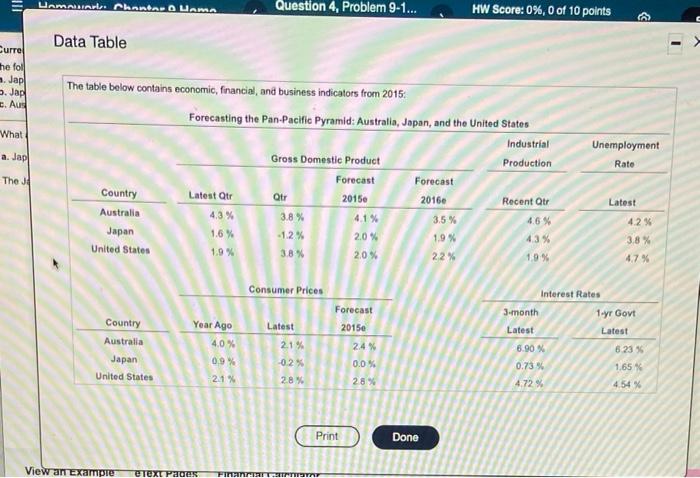
Current Spot Rates. Use the table containing economic, financial, and business Indicators to answer the following questions. What are the current spot exchange rates for the following currency exchanges? a. Japanese yen/U.S. dollar exchange rate b. Japanese yen/Australian dollar exchange rate c. Australian dollar/U.S. dollar exchange rate What are the current spot exchange rates for the following currency exchangen? a. Japanese yen U.S. dollar exchange rate The Japanese yen US dollar exchange rate is $. (Round to two decimal places.) Hamaath thantara Hama Question 4, Problem 9-1... HW Score: 0%, 0 of 10 points Data Table Curre the foll Jap Jap E. Aug What a. Jap The table below contains economic, financial and business indicators from 2015: Forecasting the Pan Pacific Pyramid: Australia, Japan, and the United States Industrial Gross Domestic Product Production Forecast Forecast Country Latest Otr 20150 2016 Recent Qtr Australia 4.3% 3.8 % 4.1% 3.5% 4.6% Japan 1.6% -1.2% 2.0% 1.9% 43% United States 1.9% 3.8 % 20% 22% 19% Unemployment Rate The JA Qtr Latest 42% 3.8% 4.7% Consumer Prices Country Australia Year Ago 40% 0.9% 2.1% Forecast 2015e 24% Latest 2.1% 02% 28% Interest Rates 3 month 1-yr Govt Latest Latest 6.90 % 6.23% 0.73% 1,65% 4.72% 4.54% Japan United States 0.0% 28% Print Done View an Example eText Pages Current Spot Rates. Use the table containing economic, financial, and business Indicators to answer the following questions. What are the current spot exchange rates for the following currency exchanges? a. Japanese yen/U.S. dollar exchange rate b. Japanese yen/Australian dollar exchange rate c. Australian dollar/U.S. dollar exchange rate What are the current spot exchange rates for the following currency exchangen? a. Japanese yen U.S. dollar exchange rate The Japanese yen US dollar exchange rate is $. (Round to two decimal places.) Hamaath thantara Hama Question 4, Problem 9-1... HW Score: 0%, 0 of 10 points Data Table Curre the foll Jap Jap E. Aug What a. Jap The table below contains economic, financial and business indicators from 2015: Forecasting the Pan Pacific Pyramid: Australia, Japan, and the United States Industrial Gross Domestic Product Production Forecast Forecast Country Latest Otr 20150 2016 Recent Qtr Australia 4.3% 3.8 % 4.1% 3.5% 4.6% Japan 1.6% -1.2% 2.0% 1.9% 43% United States 1.9% 3.8 % 20% 22% 19% Unemployment Rate The JA Qtr Latest 42% 3.8% 4.7% Consumer Prices Country Australia Year Ago 40% 0.9% 2.1% Forecast 2015e 24% Latest 2.1% 02% 28% Interest Rates 3 month 1-yr Govt Latest Latest 6.90 % 6.23% 0.73% 1,65% 4.72% 4.54% Japan United States 0.0% 28% Print Done View an Example eText Pages


