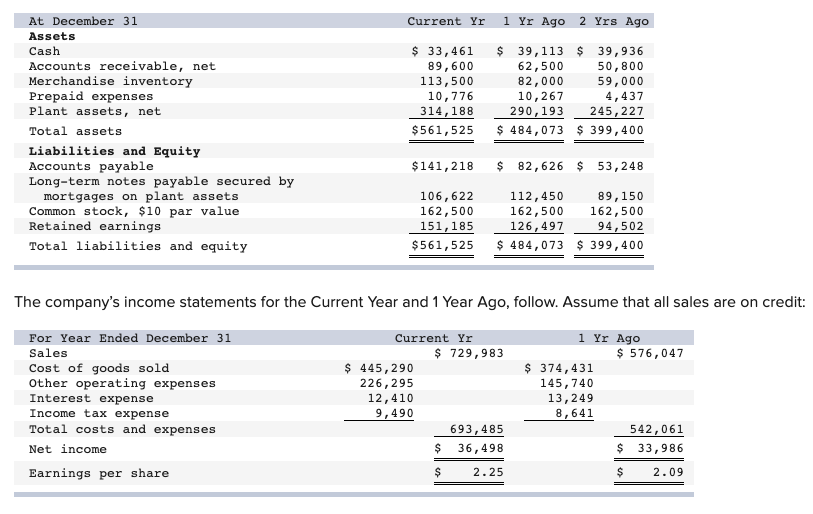


Current Yr 1 Yr Ago 2 Yrs Ago At December 31 Assets Cash Accounts receivable, net Merchandise inventory Prepaid expenses plant assets, net Total assets Liabilities and Equity Accounts payable Long-term notes payable secured by mortgages on plant assets Common stock, $10 par value Retained earnings Total liabilities and equity $ 33, 461 89,600 113,500 10,776 314,188 $561,525 $ 39,113 $ 39,936 62,500 50,800 82,000 59,000 10,267 4,437 290,193 245,227 $ 484,073 $ 399,400 $141,218 $ 82,626 $ 53,248 106,622 162,500 151,185 $561,525 112,450 89,150 162,500 162,500 126,497 94,502 $ 484,073 $ 399,400 The company's income statements for the Current Year and 1 Year Ago, follow. Assume that all sales are on credit: For Year Ended December 31 Sales Cost of goods sold Other operating expenses Interest expense Income tax expense Total costs and expenses Net income Earnings per share Current Yr $ 729,983 $ 445,290 226,295 12,410 9,490 693,485 $ 36, 498 1 Yr Ago $ 576,047 $ 374,431 145,740 13,249 8,641 542,061 $ 33,986 $ 2.09 $ 2.25 Required 1 Required 2 Required 3 (a) Which company has the better profit margin? (b) which has the better asset turnover? (c) Which has the better return on assets? (a) Which company has the better profit margin? (b) Which has the better asset turnover? (c) Which has the better return on assets? Complete this question by entering your answers in the tabs below. Required 1 Required 2 Required 3 Which company has the better rate of growth in sales? Which company has the better rate of growth in sales? Required 1 Required 2 Required 3 (a) Did Roak successfully use financial leverage in the current year? (b) Did Clay? (a) Did Roak successfully use financial leverage in the current year? (b) Did Clay? Current Yr 1 Yr Ago 2 Yrs Ago At December 31 Assets Cash Accounts receivable, net Merchandise inventory Prepaid expenses plant assets, net Total assets Liabilities and Equity Accounts payable Long-term notes payable secured by mortgages on plant assets Common stock, $10 par value Retained earnings Total liabilities and equity $ 33, 461 89,600 113,500 10,776 314,188 $561,525 $ 39,113 $ 39,936 62,500 50,800 82,000 59,000 10,267 4,437 290,193 245,227 $ 484,073 $ 399,400 $141,218 $ 82,626 $ 53,248 106,622 162,500 151,185 $561,525 112,450 89,150 162,500 162,500 126,497 94,502 $ 484,073 $ 399,400 The company's income statements for the Current Year and 1 Year Ago, follow. Assume that all sales are on credit: For Year Ended December 31 Sales Cost of goods sold Other operating expenses Interest expense Income tax expense Total costs and expenses Net income Earnings per share Current Yr $ 729,983 $ 445,290 226,295 12,410 9,490 693,485 $ 36, 498 1 Yr Ago $ 576,047 $ 374,431 145,740 13,249 8,641 542,061 $ 33,986 $ 2.09 $ 2.25 Required 1 Required 2 Required 3 (a) Which company has the better profit margin? (b) which has the better asset turnover? (c) Which has the better return on assets? (a) Which company has the better profit margin? (b) Which has the better asset turnover? (c) Which has the better return on assets? Complete this question by entering your answers in the tabs below. Required 1 Required 2 Required 3 Which company has the better rate of growth in sales? Which company has the better rate of growth in sales? Required 1 Required 2 Required 3 (a) Did Roak successfully use financial leverage in the current year? (b) Did Clay? (a) Did Roak successfully use financial leverage in the current year? (b) Did Clay


