

Question
Use the database given below to answer this question. Instructions for attempting the answer: Create a Dashboard to represent the following:
Use the database given below to answer this question.
Instructions for attempting the answer:
Create a Dashboard to represent the following:
1. Pivot chart 1 to represent the region-wise Sales in a line chart.
2. Pivot chart 2 to represent the region-wise Costs in another line chart.
3. Create a slicer on the field "Region" to be able to select one or multiple regions at a time. Make sure that both the pivot charts respond to the selection in the slicer.
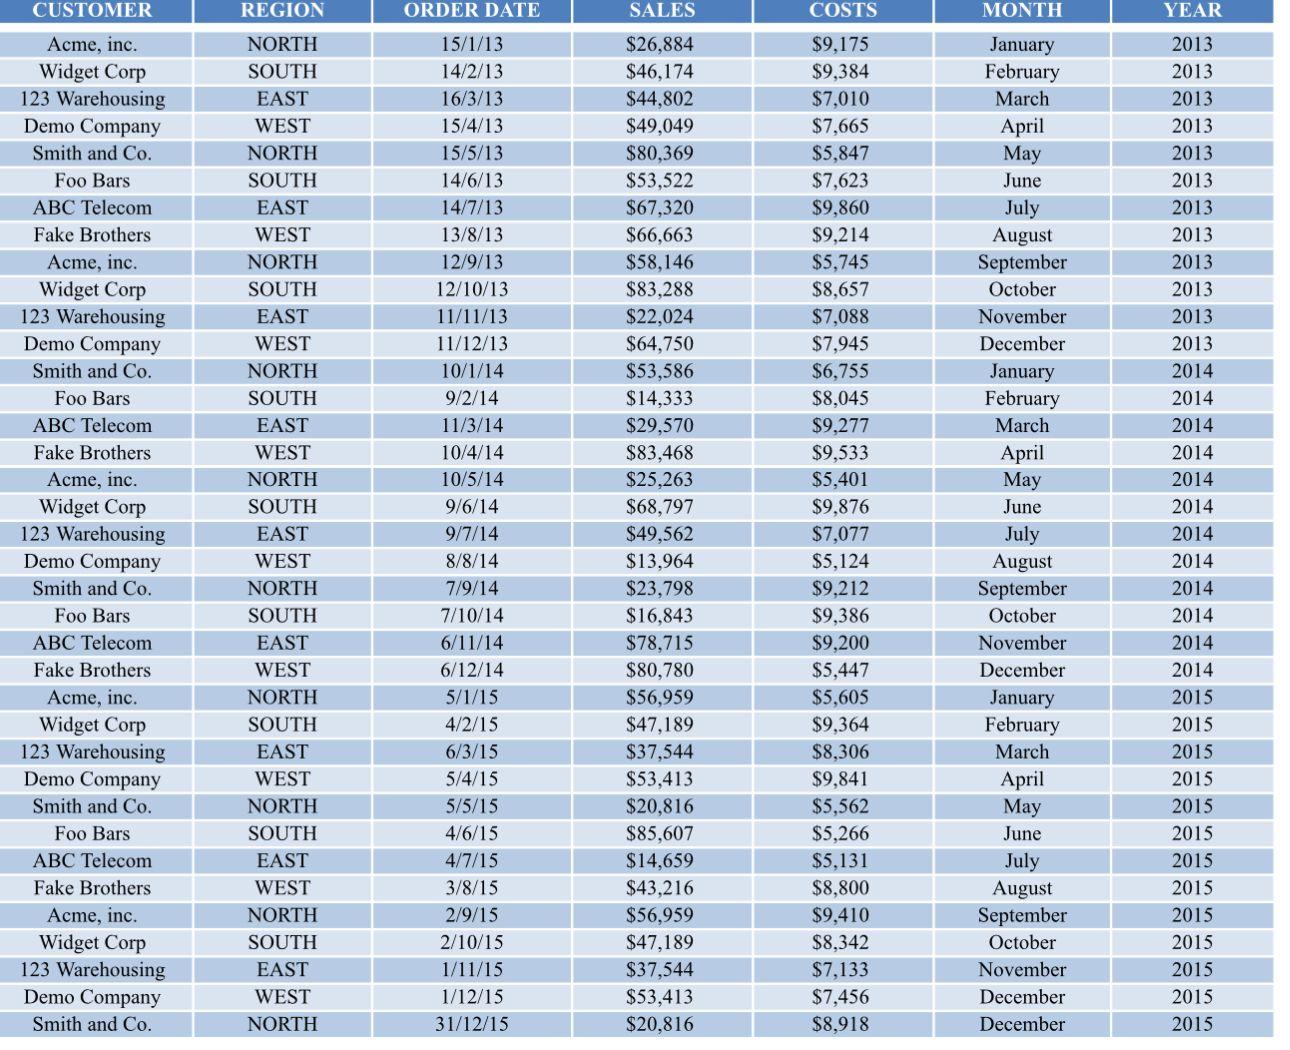
CUSTOMER Acme, inc. Widget Corp 123 Warehousing Demo Company Smith and Co. Foo Bars ABC Telecom Fake Brothers Acme, inc. Widget Corp 123 Warehousing Demo Company Smith and Co. Foo Bars ABC Telecom Fake Brothers Acme, inc. Widget Corp 123 Warehousing Demo Company Smith and Co. Foo Bars ABC Telecom Fake Brothers Acme, inc. Widget Corp 123 Warehousing Demo Company Smith and Co. Foo Bars ABC Telecom Fake Brothers Acme, inc. Widget Corp 123 Warehousing Demo Company Smith and Co. REGION NORTH SOUTH EAST WEST NORTH SOUTH EAST WEST NORTH SOUTH EAST WEST NORTH SOUTH EAST WEST NORTH SOUTH EAST WEST NORTH SOUTH EAST WEST NORTH SOUTH EAST WEST NORTH SOUTH EAST WEST NORTH SOUTH EAST WEST NORTH ORDER DATE 15/1/13 14/2/13 16/3/13 15/4/13 15/5/13 14/6/13 14/7/13 13/8/13 12/9/13 12/10/13 11/11/13 11/12/13 10/1/14 9/2/14 11/3/14 10/4/14 10/5/14 9/6/14 9/7/14 8/8/14 7/9/14 7/10/14 6/11/14 6/12/14 5/1/15 4/2/15 6/3/15 5/4/15 5/5/15 4/6/15 4/7/15 3/8/15 2/9/15 2/10/15 1/11/15 1/12/15 31/12/15 SALES $26,884 $46,174 $44,802 $49,049 $80,369 $53,522 $67,320 $66,663 $58,146 $83,288 $22,024 $64,750 $53,586 $14,333 $29,570 $83,468 $25,263 $68,797 $49,562 $13,964 $23,798 $16,843 $78,715 $80,780 $56,959 $47,189 $37,544 $53,413 $20,816 $85,607 $14,659 $43,216 $56,959 $47,189 $37,544 $53,413 $20,816 COSTS $9,175 $9,384 $7,010 $7,665 $5,847 $7,623 $9,860 $9,214 $5,745 $8,657 $7,088 $7,945 $6,755 $8,045 $9,277 $9,533 $5,401 $9,876 $7,077 $5,124 $9,212 $9,386 $9,200 $5,447 $5,605 $9,364 $8,306 $9,841 $5,562 $5,266 $5,131 $8,800 $9,410 $8,342 $7,133 $7,456 $8,918 MONTH January February March April May June July August September October November December January February March April May June July August September October November December January February March April May June July August September October November December December YEAR 2013 2013 2013 2013 2013 2013 2013 2013 2013 2013 2013 2013 2014 2014 2014 2014 2014 2014 2014 2014 2014 2014 2014 2014 2015 2015 2015 2015 2015 2015 2015 2015 2015 2015 2015 2015 2015
Step by Step Solution
3.43 Rating (153 Votes )
There are 3 Steps involved in it
Step: 1
create a dashboard to represent regionwise sales and costs using a slicer to filter data based on specific regions Several data visualization tools allow this functionality heres a general guideline I...
Get Instant Access to Expert-Tailored Solutions
See step-by-step solutions with expert insights and AI powered tools for academic success
Step: 2

Step: 3
Ace Your Homework with AI
Get the answers you need in no time with our AI-driven, step-by-step assistance
Get Started
Practical Business Statistics
Authors: Andrew Siegel
6th Edition
0123852080, 978-0123852083