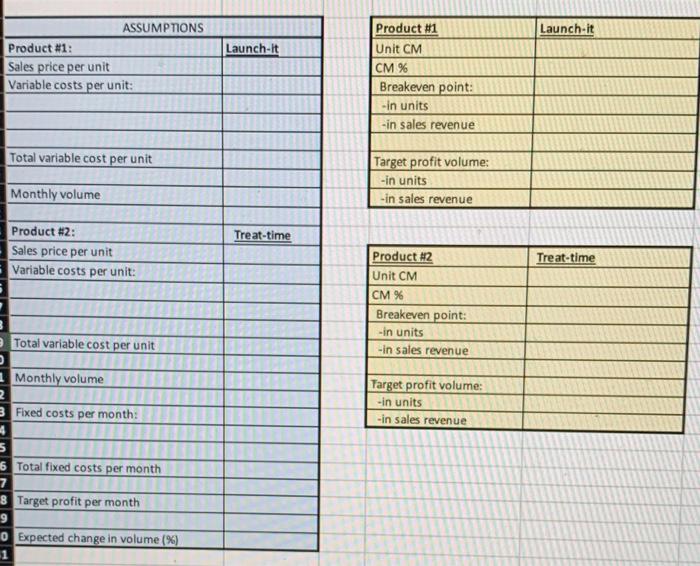
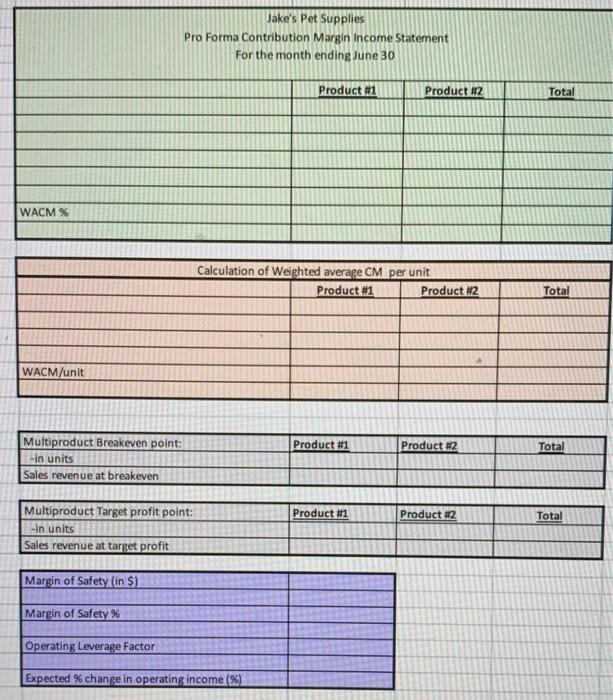
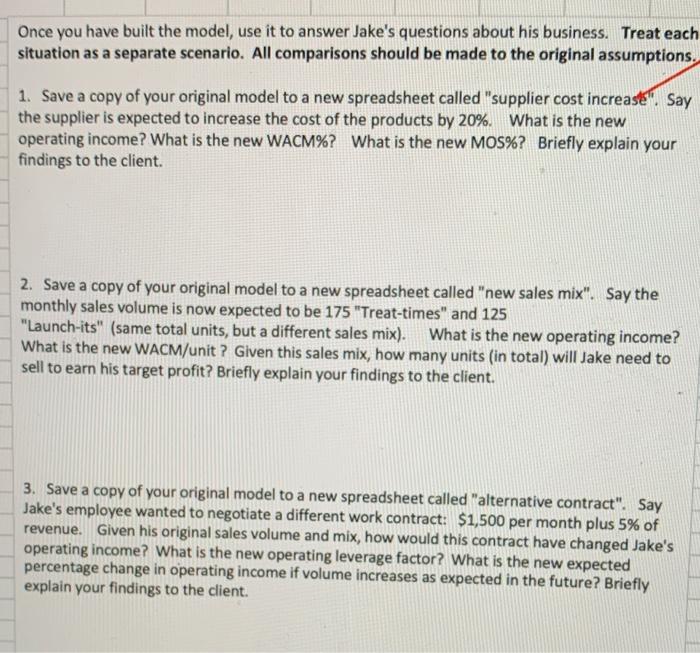
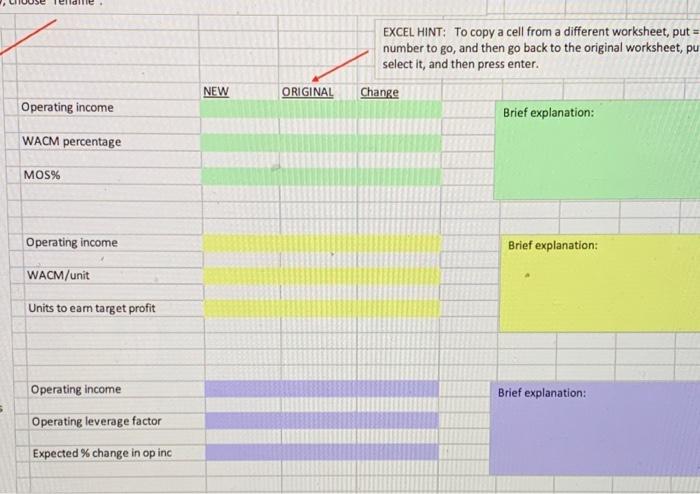
CVP Modeling Business Simulation The purpose of this business simulation is to give you experience creating a multiproduct profitability analysis that can be used to determine the effects of changing business conditions on the client's financial position. Your goal will be to use Excel in such a way that any changes to the assumptions will correctly ripple through the entire profitability analysis. If executed properly, the client should be able to use this spreadsheet over and over, using different "what if" assumptions. Check figures are provided along the way. Business Description After taking business classes, Jake, an avid dog-lover, decided to start selling unique pet supplies at trade shows. He has two products: Product 1: "Launch-it"- a tennis ball thrower that will sell for $10. Product 2: "Treat-time"- an automatic treat dispenser that releases a treat when the dog places his paw on the pedal. The treat dispenser will sell for $30. Costs: Jake has hired an employee to work the trade show booths. The work contract is $1,000 per month plus a commission equal to 10% of revenue. Jake will also spend $500 per month on trade-show entry fees. Jake is purchasing the products from a supplier in Mexico. Launch-its cost $1 each; Treat-times cost $7 each. Shipping and handling on the Launch-its will cost $2 each; Shipping and handling on the Treat-times, which are heavier, will cost $8 each. The shipping and handling costs will be paid by Jake, not the customer. Assume Jake expects to sell 200 Launch-its and 100 Treat-times during his first month of operations (June). Jake's financial goal is to earn an operating income of $8,000 per month. He believes volume may grow at a rate of 5% a month. Directions You have been hired by Jake to build a CVP model that will help him understand the impact of business conditions on his operating income. (See "Starting File" worksheet.) In your model, all of the original assumptions will be listed in one area of the spreadsheet (blue box). All other calculations in the model will reference the assumptions (blue box) such that if any assumption changes, the effect will ripple through the entire model. To accomplish this goal, you will use FORMULAs, rather than numbers, in every other cell in the worksheet. In other words, the only place you will type numbers is the blue assumptions box. FORMATTING conventions to use throughout project: - Round all UNITS to the nearest whole unit. Use the "decrease decimals" button on your tool bar rather than the Rounding function. - Show all MONETARY amounts as dollars and cents. Round to the nearest cent. ($x.xx). Use the "decrease decimals" button rather than the rounding function. - Show all percentages as %, not as decimals. (x%, not.xx) - Right justify all cells (numbers should be to the right side of the cell, not in the middle or left) 1) Complete the assumptions (blue box) based on the data about Jake's business. Identify and list all variable costs separately and all fixed costs separately before finding the total for each type of cost. 2) Complete the Product Analysis (yellow boxes) assuming Jake ONLY sells either Product #1 (Launch-its) OR Product #2 (Treat-times). Check figures: B/E Product #1 = 250 units; B/E Product #2= 125 units 3) Complete the proforma (expected) CM Income Statement for the month of June (green box). HINT: On product line income statements such as this, the fixed costs are only listed in the total column since these relate to the company as a whole, not a particular product. Make sure you also show the totals for all other line items. Finally, calculate the OVERALL WACM% for the company. How? Remember the CM% formula. It's the same here, but it becomes the weighted average simply due to the fact that the Income statement is ALREADY WEIGHTED by the number of each product expected to be sold. Check figure: Operating income = $900 WACM% = 48% 4) Calculate the weighted average contribution margin per unit (in orange box). There is more than one acceptable way to find this answer! Check figure: WACM/unit = $8.00 5) Use the WACM/ unit to calculate the TOTAL number of units needed to breakeven (TOTAL column in the first gray box). THEN, calculate the number of EACH type of product needed to breakeven. Finally, calculate the sales revenue associated with this volume for EACH product, and then the sales revenue to breakeven in total. Check figures: B/E Product #1 = 125; B/E Product #2=63 6) Use the WACM/unit to calculate the total number of units needed to achieve Jake's target profit (TOTAL column in the second gray box). THEN, calculate the number of EACH type of product needed to achieve the target profit. Finally, calculate sales revenue associated with this volume for EACH product, and then the sales revenue in total. Check figures: B/E Product #1 =792; B/E Product #2= 396 7) Calculate the MOS using June sales as the expected sales (purple box). Calculate the Mos in terms of sales revenue and as a percentage. Also calculate the current operating leverage factor (round to the nearest 2 decimal places) and use it to determine the expected percentage change in operating income stemming from an expected change in sales volume. Check figures: MOS%= 38%; Operating leverage factor= 2.67 8) Change name of worksheet to "Original Assumptions". 9) Make sure you have cleaned up your worksheet using the formatting conventions listed above. 10) Go to the "Advising dient" worksheet and follow the directions found there. 11) Check to make sure you have done everything on the grading rubric. Upload your file to Western Online when you are finished. Save your file as "Project3_Last name.xlxs" Launch-it Launch-it ASSUMPTIONS Product #1: Sales price per unit Variable costs per unit: Product #1 Unit CM CM % Breakeven point: - in units -in sales revenue Total variable cost per unit Target profit volume: -in units -in sales revenue Monthly volume Treat-time Product #2: Sales price per unit Variable costs per unit: Treat-time Product #2 Unit CM CM % Breakeven point: in units -in sales revenue Total variable cost per unit Monthly volume Target profit volume: -in units - in sales revenue 3 Fixed costs per month: 5 6 Total fixed costs per month 8 Target profit per month 9 0 Expected change in volume (%) 1 Jake's Pet Supplies Pro Forma Contribution Margin Income Statement For the month ending June 30 Product #1 Product #2 Total WACM % Calculation of Weighted average CM per unit Product #1 Product 2 Total WACM/unit Product #1 Product #2 Total Multiproduct Breakeven point: -in units Sales revenue at breakeven Product #1 Product #2 Total Multiproduct Target profit point: in units Sales revenue at target profit Margin of Safety (in $) Margin of Safety Operating Leverage Factor Expected % change in operating income (%) Once you have built the model, use it to answer Jake's questions about his business. Treat each situation as a separate scenario. All comparisons should be made to the original assumptions. 1. Save a copy of your original model to a new spreadsheet called "supplier cost increase say the supplier is expected to increase the cost of the products by 20%. What is the new operating income? What is the new WACM%? What is the new MOS%? Briefly explain your findings to the client. 2. Save a copy of your original model to a new spreadsheet called "new sales mix". Say the monthly sales volume is now expected to be 175 "Treat-times" and 125 "Launch-its" (same total units, but a different sales mix). What is the new operating income? What is the new WACM/unit ? Given this sales mix, how many units (in total) will Jake need to sell to earn his target profit? Briefly explain your findings to the client. 3. Save a copy of your original model to a new spreadsheet called "alternative contract". Say Jake's employee wanted to negotiate a different work contract: $1,500 per month plus 5% of revenue. Given his original sales volume and mix, how would this contract have changed Jake's operating income? What is the new operating leverage factor? What is the new expected percentage change in operating income if volume increases as expected in the future? Briefly explain your findings to the client. reldre EXCEL HINT: To copy a cell from a different worksheet, put = number to go, and then go back to the original worksheet, pu select it, and then press enter. Change Brief explanation: NEW ORIGINAL Operating income WACM percentage MOS% Operating income Brief explanation: WACM/unit Units to eam target profit Operating income Brief explanation: Operating leverage factor Expected % change in op ing CVP Modeling Business Simulation The purpose of this business simulation is to give you experience creating a multiproduct profitability analysis that can be used to determine the effects of changing business conditions on the client's financial position. Your goal will be to use Excel in such a way that any changes to the assumptions will correctly ripple through the entire profitability analysis. If executed properly, the client should be able to use this spreadsheet over and over, using different "what if" assumptions. Check figures are provided along the way. Business Description After taking business classes, Jake, an avid dog-lover, decided to start selling unique pet supplies at trade shows. He has two products: Product 1: "Launch-it"- a tennis ball thrower that will sell for $10. Product 2: "Treat-time"- an automatic treat dispenser that releases a treat when the dog places his paw on the pedal. The treat dispenser will sell for $30. Costs: Jake has hired an employee to work the trade show booths. The work contract is $1,000 per month plus a commission equal to 10% of revenue. Jake will also spend $500 per month on trade-show entry fees. Jake is purchasing the products from a supplier in Mexico. Launch-its cost $1 each; Treat-times cost $7 each. Shipping and handling on the Launch-its will cost $2 each; Shipping and handling on the Treat-times, which are heavier, will cost $8 each. The shipping and handling costs will be paid by Jake, not the customer. Assume Jake expects to sell 200 Launch-its and 100 Treat-times during his first month of operations (June). Jake's financial goal is to earn an operating income of $8,000 per month. He believes volume may grow at a rate of 5% a month. Directions You have been hired by Jake to build a CVP model that will help him understand the impact of business conditions on his operating income. (See "Starting File" worksheet.) In your model, all of the original assumptions will be listed in one area of the spreadsheet (blue box). All other calculations in the model will reference the assumptions (blue box) such that if any assumption changes, the effect will ripple through the entire model. To accomplish this goal, you will use FORMULAs, rather than numbers, in every other cell in the worksheet. In other words, the only place you will type numbers is the blue assumptions box. FORMATTING conventions to use throughout project: - Round all UNITS to the nearest whole unit. Use the "decrease decimals" button on your tool bar rather than the Rounding function. - Show all MONETARY amounts as dollars and cents. Round to the nearest cent. ($x.xx). Use the "decrease decimals" button rather than the rounding function. - Show all percentages as %, not as decimals. (x%, not.xx) - Right justify all cells (numbers should be to the right side of the cell, not in the middle or left) 1) Complete the assumptions (blue box) based on the data about Jake's business. Identify and list all variable costs separately and all fixed costs separately before finding the total for each type of cost. 2) Complete the Product Analysis (yellow boxes) assuming Jake ONLY sells either Product #1 (Launch-its) OR Product #2 (Treat-times). Check figures: B/E Product #1 = 250 units; B/E Product #2= 125 units 3) Complete the proforma (expected) CM Income Statement for the month of June (green box). HINT: On product line income statements such as this, the fixed costs are only listed in the total column since these relate to the company as a whole, not a particular product. Make sure you also show the totals for all other line items. Finally, calculate the OVERALL WACM% for the company. How? Remember the CM% formula. It's the same here, but it becomes the weighted average simply due to the fact that the Income statement is ALREADY WEIGHTED by the number of each product expected to be sold. Check figure: Operating income = $900 WACM% = 48% 4) Calculate the weighted average contribution margin per unit (in orange box). There is more than one acceptable way to find this answer! Check figure: WACM/unit = $8.00 5) Use the WACM/ unit to calculate the TOTAL number of units needed to breakeven (TOTAL column in the first gray box). THEN, calculate the number of EACH type of product needed to breakeven. Finally, calculate the sales revenue associated with this volume for EACH product, and then the sales revenue to breakeven in total. Check figures: B/E Product #1 = 125; B/E Product #2=63 6) Use the WACM/unit to calculate the total number of units needed to achieve Jake's target profit (TOTAL column in the second gray box). THEN, calculate the number of EACH type of product needed to achieve the target profit. Finally, calculate sales revenue associated with this volume for EACH product, and then the sales revenue in total. Check figures: B/E Product #1 =792; B/E Product #2= 396 7) Calculate the MOS using June sales as the expected sales (purple box). Calculate the Mos in terms of sales revenue and as a percentage. Also calculate the current operating leverage factor (round to the nearest 2 decimal places) and use it to determine the expected percentage change in operating income stemming from an expected change in sales volume. Check figures: MOS%= 38%; Operating leverage factor= 2.67 8) Change name of worksheet to "Original Assumptions". 9) Make sure you have cleaned up your worksheet using the formatting conventions listed above. 10) Go to the "Advising dient" worksheet and follow the directions found there. 11) Check to make sure you have done everything on the grading rubric. Upload your file to Western Online when you are finished. Save your file as "Project3_Last name.xlxs" Launch-it Launch-it ASSUMPTIONS Product #1: Sales price per unit Variable costs per unit: Product #1 Unit CM CM % Breakeven point: - in units -in sales revenue Total variable cost per unit Target profit volume: -in units -in sales revenue Monthly volume Treat-time Product #2: Sales price per unit Variable costs per unit: Treat-time Product #2 Unit CM CM % Breakeven point: in units -in sales revenue Total variable cost per unit Monthly volume Target profit volume: -in units - in sales revenue 3 Fixed costs per month: 5 6 Total fixed costs per month 8 Target profit per month 9 0 Expected change in volume (%) 1 Jake's Pet Supplies Pro Forma Contribution Margin Income Statement For the month ending June 30 Product #1 Product #2 Total WACM % Calculation of Weighted average CM per unit Product #1 Product 2 Total WACM/unit Product #1 Product #2 Total Multiproduct Breakeven point: -in units Sales revenue at breakeven Product #1 Product #2 Total Multiproduct Target profit point: in units Sales revenue at target profit Margin of Safety (in $) Margin of Safety Operating Leverage Factor Expected % change in operating income (%) Once you have built the model, use it to answer Jake's questions about his business. Treat each situation as a separate scenario. All comparisons should be made to the original assumptions. 1. Save a copy of your original model to a new spreadsheet called "supplier cost increase say the supplier is expected to increase the cost of the products by 20%. What is the new operating income? What is the new WACM%? What is the new MOS%? Briefly explain your findings to the client. 2. Save a copy of your original model to a new spreadsheet called "new sales mix". Say the monthly sales volume is now expected to be 175 "Treat-times" and 125 "Launch-its" (same total units, but a different sales mix). What is the new operating income? What is the new WACM/unit ? Given this sales mix, how many units (in total) will Jake need to sell to earn his target profit? Briefly explain your findings to the client. 3. Save a copy of your original model to a new spreadsheet called "alternative contract". Say Jake's employee wanted to negotiate a different work contract: $1,500 per month plus 5% of revenue. Given his original sales volume and mix, how would this contract have changed Jake's operating income? What is the new operating leverage factor? What is the new expected percentage change in operating income if volume increases as expected in the future? Briefly explain your findings to the client. reldre EXCEL HINT: To copy a cell from a different worksheet, put = number to go, and then go back to the original worksheet, pu select it, and then press enter. Change Brief explanation: NEW ORIGINAL Operating income WACM percentage MOS% Operating income Brief explanation: WACM/unit Units to eam target profit Operating income Brief explanation: Operating leverage factor Expected % change in op ing