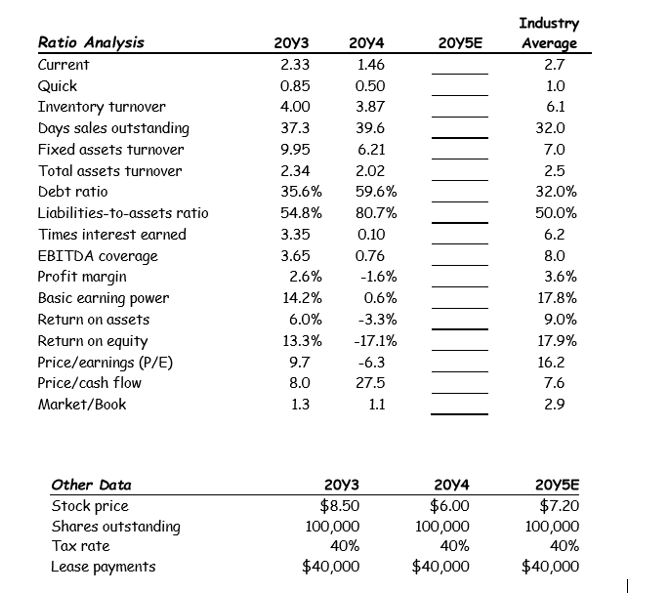
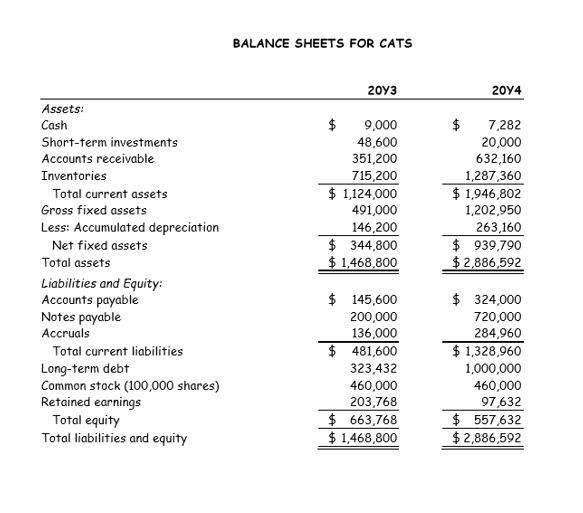
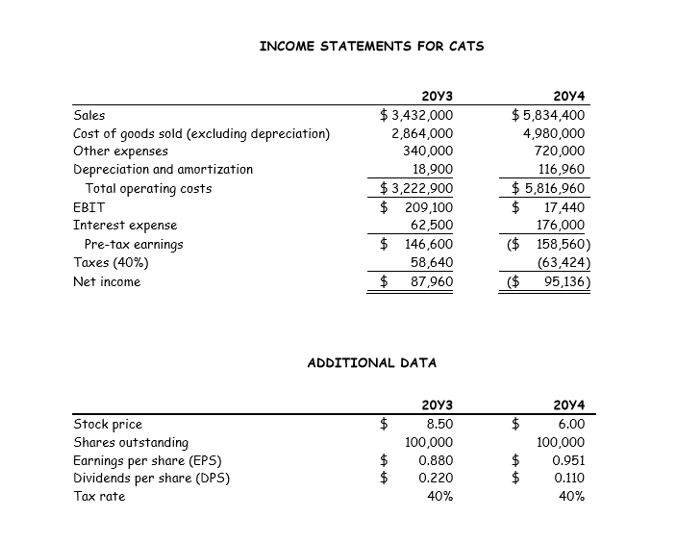
d. Calculate the following profitability ratios for CATS for F20Y5E: net profit margin; basic earning power; return on total assets; and return on common equity. What can you say about these ratios?

The finance group at CATS is working on forecasting its financial statements for 20Y5. They are working with the following assumptions:
CATS will invest $180,000 in fixed assets in 20Y5; depreciation expense will increase by $17,469 in 20Y5 over the 20Y4 amount.
CATS will fund the investment in fixed assets with a long-term loan of $180,000. Interest expense will increase by $16,300 in 20Y5 over the 20Y4 amount. There will no change in the number of shares of common stock.
CATS will increase its common dividend by 5%.
The marketing group estimates that sales will increase 12.5% in 20Y5.
All NOWC accounts, except cash, will increase by 10% over the 20Y4 amounts. The ending cash balance for 20Y5 is expected to increase 22% over the 20Y4 amount. ST investments will remain constant.
The ratio of operating expenses (excluding other expenses and depreciation) to sales will decline from ~85.4% to 83%. The other expenses item on the income statement will increase 3%. The tax rate will remain at 40%.
The WACC for CATS is expected to remain at 10% for 20Y5.
Any additional funds needed (AFN) will come from a short-term borrowing, i.e., an increase in notes payable. Similarly, any funds released would be used to reduce notes payable. In other words, notes payable is a plug variable which will be used to balance the balance sheet.


20y5E Ratio Analysis Current Quick Inventory turnover Days sales outstanding Fixed assets turnover Total assets turnover Debt ratio Liabilities-to-assets ratio Times interest earned EBITDA coverage Profit margin Basic earning power Return on assets Return on equity Price/earnings (P/E) Price/cash flow Market/Book 20y3 2.33 0.85 4.00 37.3 9.95 2.34 35.6% 54.8% 3.35 3.65 2.6% 14.2% 6.0% 13.3% 2074 1.46 0.50 3.87 39.6 6.21 2.02 59.6% 80.7% 0.10 0.76 -1.6% 0.6% -3.3% -17.1% -6.3 27.5 1.1 Industry Average 2.7 1.0 6.1 32.0 7.0 2.5 32.0% 50.0% 6.2 8.0 3.6% 17.8% 9.0% 17.9% 16.2 7.6 2.9 9.7 8.0 1.3 Other Data Stock price Shares outstanding Tax rate Lease payments 20y3 $8.50 100,000 40% $40,000 2014 $6.00 100,000 40% $40,000 20y5E $7.20 100,000 40% $40,000 | BALANCE SHEETS FOR CATS 2013 2014 $ 9,000 48,600 351,200 715,200 $ 1,124,000 491,000 146,200 $ 344,800 $ 1,468,800 7,282 20,000 632,160 1,287,360 $ 1,946,802 1,202,950 263,160 $ 939,790 $ 2,886,592 Assets: Cash Short-term investments Accounts receivable Inventories Total current assets Gross fixed assets Less: Accumulated depreciation Net fixed assets Total assets Liabilities and Equity: Accounts payable Notes payable Accruals Total current liabilities Long-term debt Common stock (100,000 shares) Retained earnings Total equity Total liabilities and equity $ 145,600 200,000 136,000 $ 481,600 323,432 460,000 203,768 $ 663,768 $ 1,468,800 $ 324,000 720,000 284,960 $ 1,328,960 1,000,000 460,000 97,632 $ 557,632 $ 2,886,592 INCOME STATEMENTS FOR CATS Sales Cost of goods sold (excluding depreciation) Other expenses Depreciation and amortization Total operating costs EBIT Interest expense Pre-tax earnings Taxes (40%) Net income 2013 $ 3,432,000 2,864,000 340,000 18,900 $3,222,900 $ 209,100 62,500 $ 146,600 58,640 $ 87,960 2014 $5,834,400 4,980,000 720,000 116,960 $ 5,816,960 17,440 176,000 ($ 158,560) (63,424) ($ 95,136) ADDITIONAL DATA $ $ Stock price Shares outstanding Earnings per share (EPS) Dividends per share (DPS) Tax rate 2013 8.50 100,000 0.880 0.220 40% 2014 6.00 100,000 0.951 0.110 40% $ $ $ ta 20y5E Ratio Analysis Current Quick Inventory turnover Days sales outstanding Fixed assets turnover Total assets turnover Debt ratio Liabilities-to-assets ratio Times interest earned EBITDA coverage Profit margin Basic earning power Return on assets Return on equity Price/earnings (P/E) Price/cash flow Market/Book 20y3 2.33 0.85 4.00 37.3 9.95 2.34 35.6% 54.8% 3.35 3.65 2.6% 14.2% 6.0% 13.3% 2074 1.46 0.50 3.87 39.6 6.21 2.02 59.6% 80.7% 0.10 0.76 -1.6% 0.6% -3.3% -17.1% -6.3 27.5 1.1 Industry Average 2.7 1.0 6.1 32.0 7.0 2.5 32.0% 50.0% 6.2 8.0 3.6% 17.8% 9.0% 17.9% 16.2 7.6 2.9 9.7 8.0 1.3 Other Data Stock price Shares outstanding Tax rate Lease payments 20y3 $8.50 100,000 40% $40,000 2014 $6.00 100,000 40% $40,000 20y5E $7.20 100,000 40% $40,000 | BALANCE SHEETS FOR CATS 2013 2014 $ 9,000 48,600 351,200 715,200 $ 1,124,000 491,000 146,200 $ 344,800 $ 1,468,800 7,282 20,000 632,160 1,287,360 $ 1,946,802 1,202,950 263,160 $ 939,790 $ 2,886,592 Assets: Cash Short-term investments Accounts receivable Inventories Total current assets Gross fixed assets Less: Accumulated depreciation Net fixed assets Total assets Liabilities and Equity: Accounts payable Notes payable Accruals Total current liabilities Long-term debt Common stock (100,000 shares) Retained earnings Total equity Total liabilities and equity $ 145,600 200,000 136,000 $ 481,600 323,432 460,000 203,768 $ 663,768 $ 1,468,800 $ 324,000 720,000 284,960 $ 1,328,960 1,000,000 460,000 97,632 $ 557,632 $ 2,886,592 INCOME STATEMENTS FOR CATS Sales Cost of goods sold (excluding depreciation) Other expenses Depreciation and amortization Total operating costs EBIT Interest expense Pre-tax earnings Taxes (40%) Net income 2013 $ 3,432,000 2,864,000 340,000 18,900 $3,222,900 $ 209,100 62,500 $ 146,600 58,640 $ 87,960 2014 $5,834,400 4,980,000 720,000 116,960 $ 5,816,960 17,440 176,000 ($ 158,560) (63,424) ($ 95,136) ADDITIONAL DATA $ $ Stock price Shares outstanding Earnings per share (EPS) Dividends per share (DPS) Tax rate 2013 8.50 100,000 0.880 0.220 40% 2014 6.00 100,000 0.951 0.110 40% $ $ $ ta


