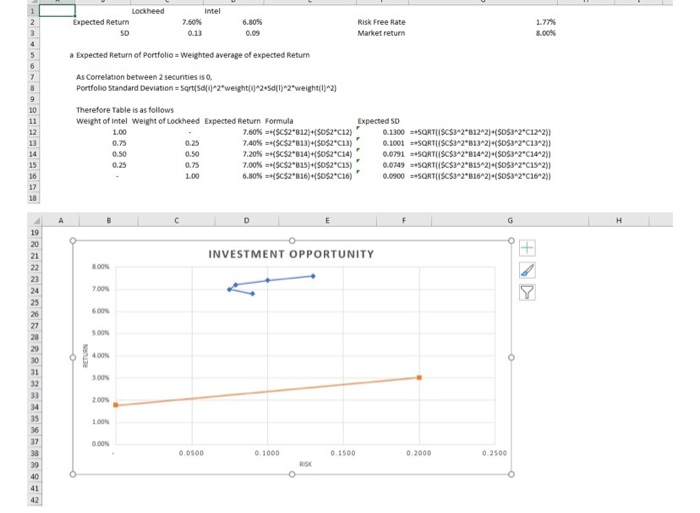

d. Draw a set of indifference curves somewhere to the right of the tangency point between the CML and the curve of attainable portfolios. There should be indifference curves both above and below CML line and curve. Explain how you, as a rational investor, will choose a utility maximizing portfolio: i. In the absence of capital markets (i.e. no risk-free asset available so no CML exists) ii. With capital markets (includes the risk-free asset) d. Draw a set of indifference curves somewhere to the right of the tangency point between the CML and the curve of attainable portfolios. There should be indifference curves both above and below CML line and curve. Explain how you, as a rational investor, will choose a utility maximizing portfolio: i. In the absence of capital markets (i.e. no risk-free asset available so no CML exists) ii. With capital markets (includes the risk-free asset) Lockheed Intel Expected Return 7.60% 6.80% Risk Free Rate Market return 1.77% 8.00% SO 013 0.09 a Expected Return of Portfolio Weighted average of expected Return As Correlation between 2 securities is Portfolio Standard Deviation = sqrt {02weight 2 sd(1) 2"weight(1)^2) 1.00 Therefore Table is as follows Weight of Intel Weight of Lockheed Expected Return Formula 7.60% = $c$2312)+($0$2*12) 0.25 7.40% ($C$ 2 13)$0$2013) 0.50 0.50 7.20%="{$C$2814)$0$2014) 0.75 7.00 (SCS1550SCIS) 6.80% = $C$2816)+($0$2016) Expected SD 0.1300 +5QRTIISC$3^2*812^2)+($D$3*2*C122) 0.1001 - SORTUISCS-20813-214($D$32"C1342)) 0.0791 SSORTISCS3^2*814^2)+(SD$32C14^2) 0.0249 - SORTUISCS-2B15^2)+($D$3^2"C1542)) 0.0900 - SORTUISCS3*2*316 2]+($D$3"2"C162) 025 1.00 INVESTMENT OPPORTUNITY s.co 0.1000 0.1500 0.2000 0.2500 d. Draw a set of indifference curves somewhere to the right of the tangency point between the CML and the curve of attainable portfolios. There should be indifference curves both above and below CML line and curve. Explain how you, as a rational investor, will choose a utility maximizing portfolio: i. In the absence of capital markets (i.e. no risk-free asset available so no CML exists) ii. With capital markets (includes the risk-free asset) d. Draw a set of indifference curves somewhere to the right of the tangency point between the CML and the curve of attainable portfolios. There should be indifference curves both above and below CML line and curve. Explain how you, as a rational investor, will choose a utility maximizing portfolio: i. In the absence of capital markets (i.e. no risk-free asset available so no CML exists) ii. With capital markets (includes the risk-free asset) Lockheed Intel Expected Return 7.60% 6.80% Risk Free Rate Market return 1.77% 8.00% SO 013 0.09 a Expected Return of Portfolio Weighted average of expected Return As Correlation between 2 securities is Portfolio Standard Deviation = sqrt {02weight 2 sd(1) 2"weight(1)^2) 1.00 Therefore Table is as follows Weight of Intel Weight of Lockheed Expected Return Formula 7.60% = $c$2312)+($0$2*12) 0.25 7.40% ($C$ 2 13)$0$2013) 0.50 0.50 7.20%="{$C$2814)$0$2014) 0.75 7.00 (SCS1550SCIS) 6.80% = $C$2816)+($0$2016) Expected SD 0.1300 +5QRTIISC$3^2*812^2)+($D$3*2*C122) 0.1001 - SORTUISCS-20813-214($D$32"C1342)) 0.0791 SSORTISCS3^2*814^2)+(SD$32C14^2) 0.0249 - SORTUISCS-2B15^2)+($D$3^2"C1542)) 0.0900 - SORTUISCS3*2*316 2]+($D$3"2"C162) 025 1.00 INVESTMENT OPPORTUNITY s.co 0.1000 0.1500 0.2000 0.2500


