

Answered step by step
Verified Expert Solution
Question
1 Approved Answer
D E F G A 1 Bond Valuation 2 4 Years to maturity 5 Number of coupon payment per year 6 Coupont 7 Par value
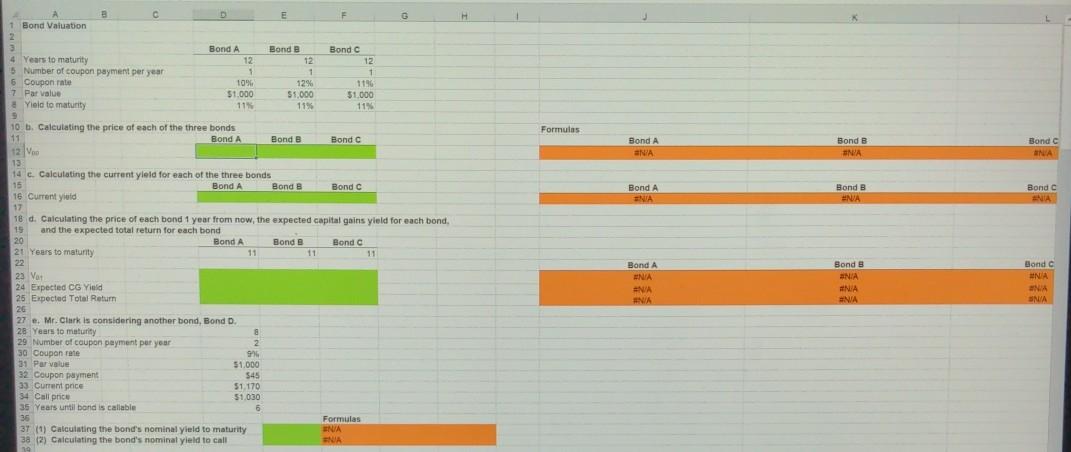
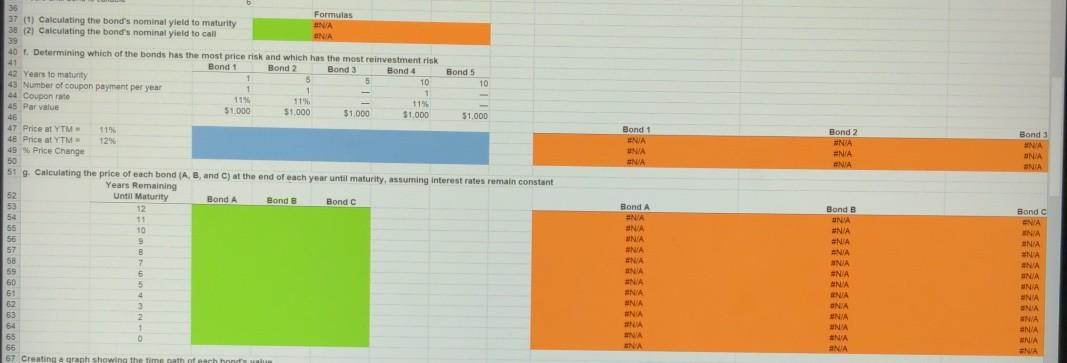
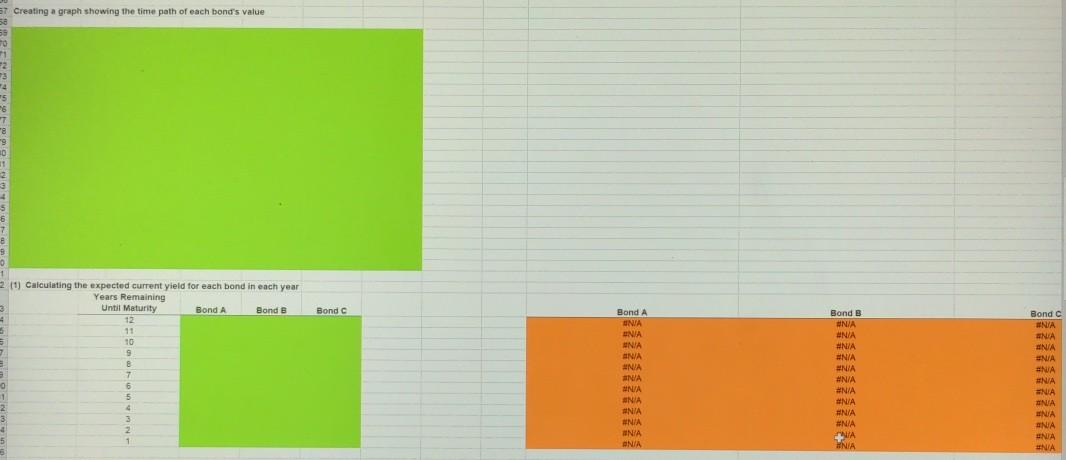
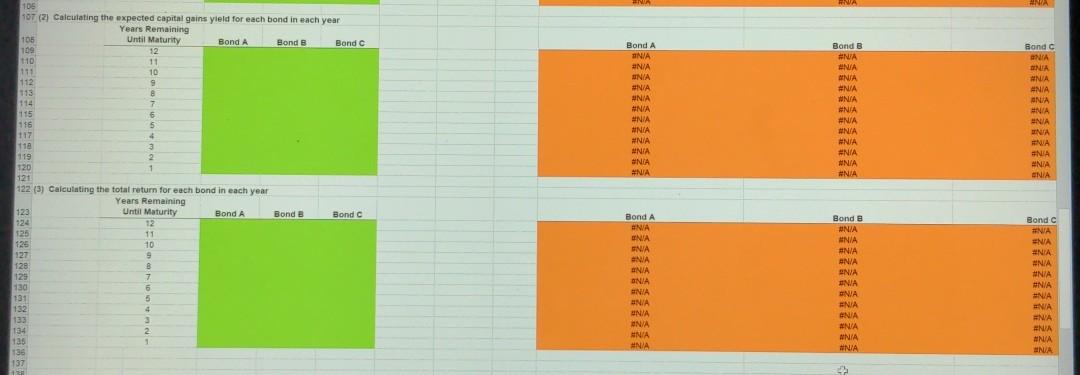
D E F G A 1 Bond Valuation 2 4 Years to maturity 5 Number of coupon payment per year 6 Coupont 7 Par value # Yield to maturity Bond A 12 1 1096 $1.000 115 Bonde 12 1 12% $5,000 11% Bond C 12 1 1 1190 $1.000 11% % Formulas Bond A aNIA. Bond B NA Bond ANA Bond A ENA Bond B NA Bond ANA 10 b. Calculating the price of each of the three bonds 11 Bond A Bond B Bond 112 Voo 13 14 c. Calculating the current yield for each of the three bonds 15 Bond A Bond B Bond 18 Current yield 17 18 d. Calculating the price of each bond 1 year from now, the expected capital gains yield for each bond, 15 and the expected total return for each bond 20 Bond A Bond B Bond 20 Years to matunity 11 11 22 23 Vos 24 Expected CG Yield 25 Expected Total Retur 26 27 e. Mr. Clark is considering another bond, Bond D. 28 Years to maturity 8 29 Number of coupon payment per year 2 2 30 Coupon rate 996 31 Par value 51.000 32 Coupon payment $45 33 Current price 51.170 34 Call price 51.030 35 Years until bond is callable 6 36 Formulas 3T (1) Calculating the bond's nominal yield to maturity N/A NA 38 (2) Calculating the bond's nominal yield to call NA Bond A ENIA ANA ANA Bond NIA ANA #NA Bond c NA NA SNA 19 Bond 1 NA UNIA UNA Bond 2 WNIA #NIA ENA Bond 3 UNA ONIA ONIA 36 Formulas 37 (1) Calculating the bond's nominal yield to maturity 38 (2) Calculating the bond's nominal yield to call ANA 39 40 t Determining which of the bonds has the most price risk and which has the most reinvestment risk 41 Bond 1 Bond 2 Band 3 Bond 4 Bond 5 42 Years to maturity 1 5 5 TO 10 43 Number of coupon payment per year 1 1 1 44 Coupon 11 45 Par value 11% 51.000 $1.000 $1,000 $1.000 $1,000 46 47 Price at YTM 115. 48 Price at YTM 12% 49 Price Change 50 51 9. Calculating the price of each bond (A, B, and C) at the end of each year until maturity, assuming interest rates remain constant Years Remaining 52 Until Maturity Band A A Bond a Bond c 50 12 54 11 55 10 56 9 57 B 68 17 59 6 60 5 61 4 2 63 64 + 65 66 67 Creating a graph showing the time path of each hond watu Bond A NA NA UNIA #NA ENA INA #NIA ENIA MINIA #NA UA NA NA Bond B UNIA #N/A #NA ANA UNIA #NIA ANA Bond C NA UNIA UNA NA ONIA UNIA SNA #NA ANIA UNA UNA #NA ONIA WNIA NA NIA NA Creating a graph showing the time path of each bond's value 2 (1) Calculating the expected yield for each bond in each year 12 ed capital gains yield for each bond in each year Bond A Bond
Step by Step Solution
There are 3 Steps involved in it
Step: 1

Get Instant Access to Expert-Tailored Solutions
See step-by-step solutions with expert insights and AI powered tools for academic success
Step: 2

Step: 3
Ace Your Homework with AI
Get the answers you need in no time with our AI-driven, step-by-step assistance
Get Started
Technology And Finance Challenges For Financial Markets Business Strategies And Policy Makers
Authors: Morten Balling, Frank Lierman, Andy Mullineux
1st Edition
041529827X, 978-0415298278