

Answered step by step
Verified Expert Solution
Question
1 Approved Answer
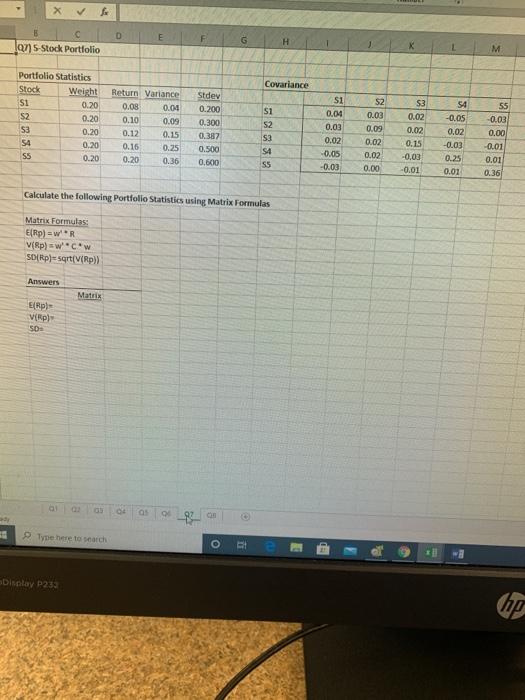
D E F G H 07) 5-Stock Portfolio M Covariance S3 Portfolio Statistics Stock Weight S1 0.20 S2 0.20 53 0.20 54 0,20 S5 0.20
Step by Step Solution
There are 3 Steps involved in it
Step: 1

Get Instant Access to Expert-Tailored Solutions
See step-by-step solutions with expert insights and AI powered tools for academic success
Step: 2

Step: 3
Ace Your Homework with AI
Get the answers you need in no time with our AI-driven, step-by-step assistance
Get Started
Foundations Of Financial Management
Authors: Stanley B. Block, Geoffrey A. Hirt, Bartley R. Danielsen
13th Edition
0073382388, 978-0073382388