

Answered step by step
Verified Expert Solution
Question
1 Approved Answer
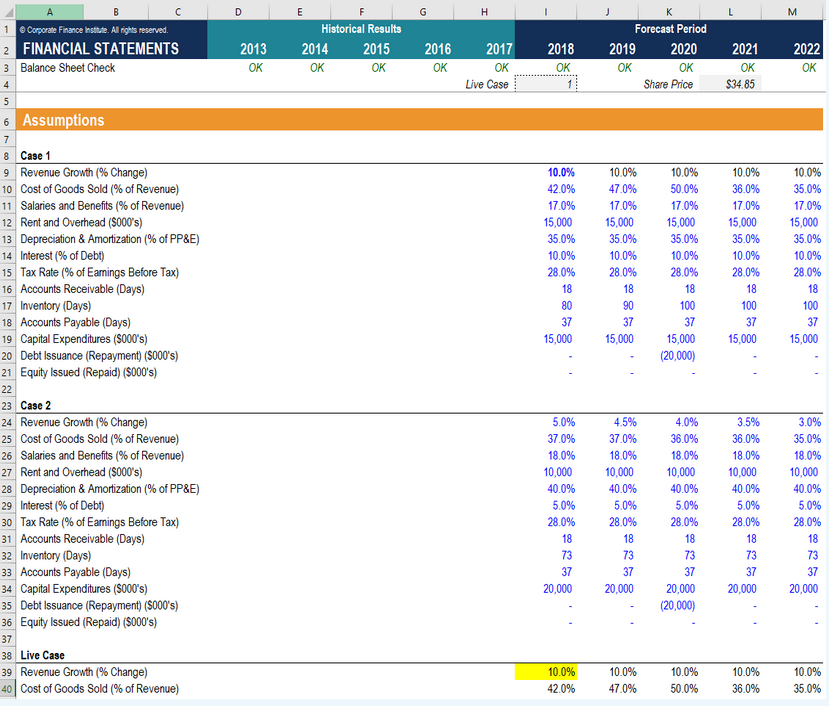
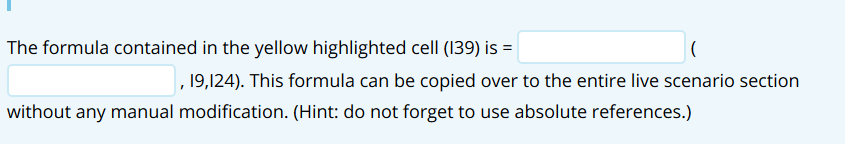
D E F G H ) K M 2013 OK Historical Results 2014 2015 OK OK 2016 OK 2017 OK Live Case 2018 OK Forecast
Step by Step Solution
There are 3 Steps involved in it
Step: 1

Get Instant Access to Expert-Tailored Solutions
See step-by-step solutions with expert insights and AI powered tools for academic success
Step: 2

Step: 3
Ace Your Homework with AI
Get the answers you need in no time with our AI-driven, step-by-step assistance
Get Started
Introduction To Finance Financial Management And Investment Management
Authors: Pamela P. Drake, Frank J. Fabozzi, Francesco A. Fabozzi
1st Edition
9811239657, 978-9811239656