

Answered step by step
Verified Expert Solution
Question
1 Approved Answer
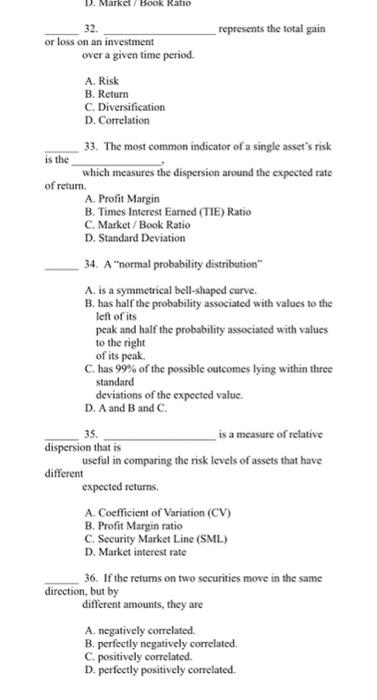
D. Market Book Ratio 32. represents the total gain or loss on an investment over a given time period. A. Risk B. Return C. Diversification
Step by Step Solution
There are 3 Steps involved in it
Step: 1

Get Instant Access to Expert-Tailored Solutions
See step-by-step solutions with expert insights and AI powered tools for academic success
Step: 2

Step: 3
Ace Your Homework with AI
Get the answers you need in no time with our AI-driven, step-by-step assistance
Get Started
Financial Planning Demystified A Self Teaching Guide
Authors: Paul Lim
1st Edition
0071476717,0071709711