Answered step by step
Verified Expert Solution
Link Copied!

Question

1 Approved Answer

D Question 2 1.5 pts The textbook discusses three types of analyses: ratio, trend and vertical. What type of analysis does this chart represent? Fiscal
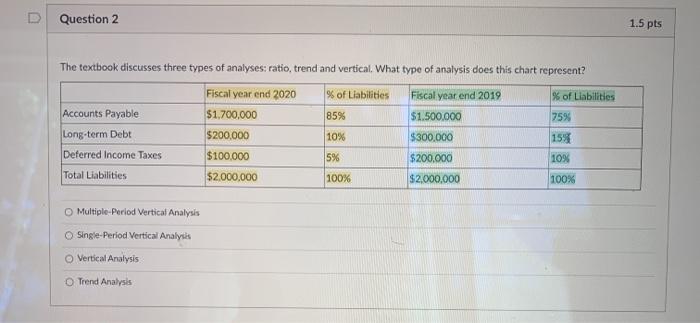
image text in transcribed
D Question 2 1.5 pts The textbook discusses three types of analyses: ratio, trend and vertical. What type of analysis does this chart represent? Fiscal year end 2020 % of Liabilities Fiscal year end 2019 % of Liabilities Accounts Payable $1,700,000 85% $1.500.000 75% Long-term Debt $200,000 10% $300,000 15% Deferred Income Taxes $100,000 5% $200,000 10% Total Liabilities $2,000,000 100% $2.000.000 100% O Multiple Period Vertical Analysis Single-Period Vertical Analysis O Vertical Analysis Trend Analysis

Step by Step Solution

There are 3 Steps involved in it

Step: 1

blur-text-image

Get Instant Access to Expert-Tailored Solutions

See step-by-step solutions with expert insights and AI powered tools for academic success

Step: 2

blur-text-image_2

Step: 3

blur-text-image_3

Ace Your Homework with AI

Get the answers you need in no time with our AI-driven, step-by-step assistance

Get Started

Recommended Textbook for

Real Estate Post Pandemic And Digital Real Estate

Authors: Fred Nickerson

1st Edition

979-8834591344

More Books

Students also viewed these Finance questions