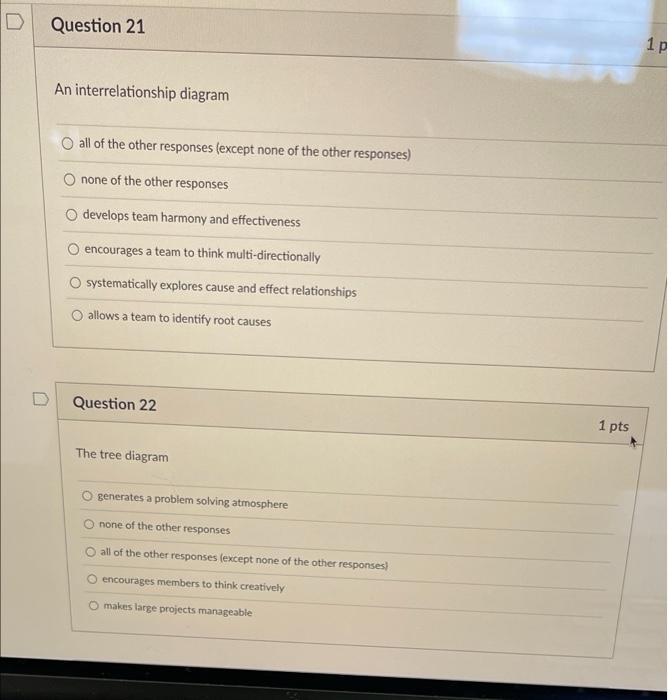
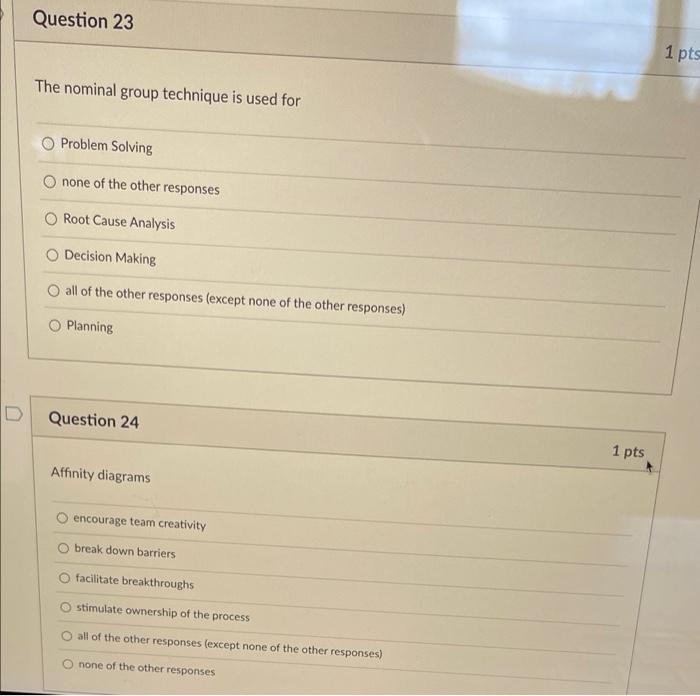
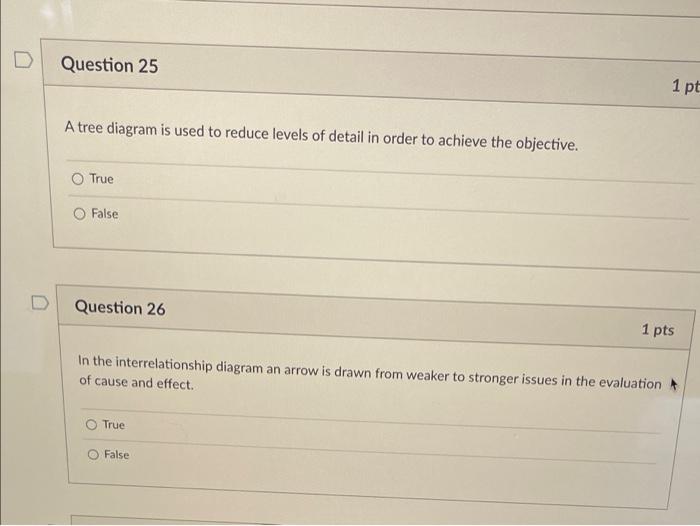
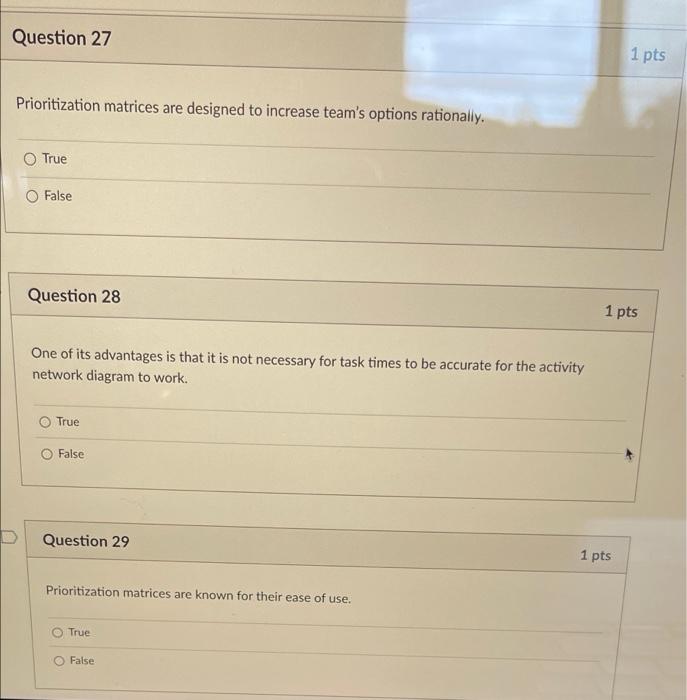
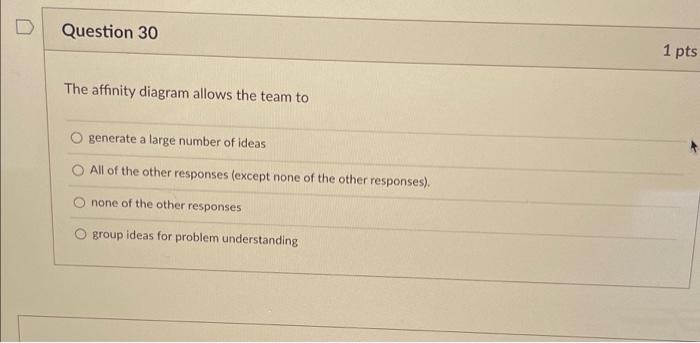
D Question 21 1p An interrelationship diagram all of the other responses (except none of the other responses) none of the other responses develops team harmony and effectiveness encourages a team to think multi-directionally systematically explores cause and effect relationships allows a team to identify root causes D Question 22 1 pts The tree diagram O generates a problem solving atmosphere none of the other responses all of the other responses (except none of the other responses) encourages members to think creatively makes large projects manageable Question 23 1 pts The nominal group technique is used for Problem Solving none of the other responses Root Cause Analysis Decision Making all of the other responses (except none of the other responses) O Planning D Question 24 1 pts Affinity diagrams encourage team creativity break down barriers facilitate breakthroughs stimulate ownership of the process all of the other responses (except none of the other responses) none of the other responses Question 25 1 pt A tree diagram is used to reduce levels of detail in order to achieve the objective. O True O False Question 26 1 pts In the interrelationship diagram an arrow is drawn from weaker to stronger issues in the evaluation of cause and effect. True False Question 27 1 pts Prioritization matrices are designed to increase team's options rationally. True False Question 28 1 pts One of its advantages is that it is not necessary for task times to be accurate for the activity network diagram to work. True False Question 29 1 pts Prioritization matrices are known for their ease of use. True False Question 30 1 pts The affinity diagram allows the team to generate a large number of ideas All of the other responses (except none of the other responses), none of the other responses O group ideas for problem understanding