Answered step by step
Verified Expert Solution
Link Copied!

Question

1 Approved Answer

D Question 22 7 pts The following Table shows part of the SUMMARY RATIOS (percentage of Average Total Assets) report for Santa Clara bank and
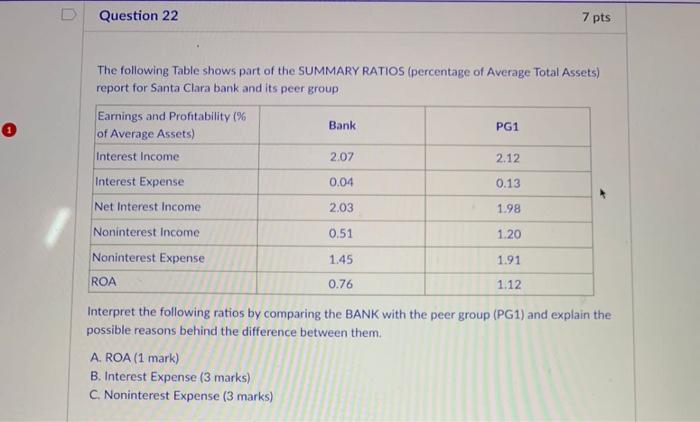
image text in transcribed
D Question 22 7 pts The following Table shows part of the SUMMARY RATIOS (percentage of Average Total Assets) report for Santa Clara bank and its peer group Earnings and Profitability (% Bank PG1 of Average Assets) Interest Income 2.07 2.12 Interest Expense 0.04 0.13 Net Interest Income 2.03 1.98 Noninterest Income 0.51 1.20 Noninterest Expense 1.45 1.91 ROA 0.76 1.12 Interpret the following ratios by comparing the BANK with the peer group (PG1) and explain the possible reasons behind the difference between them. A. ROA (1 mark) B. Interest Expense (3 marks) C. Noninterest Expense

Step by Step Solution

There are 3 Steps involved in it

Step: 1

blur-text-image

Get Instant Access to Expert-Tailored Solutions

See step-by-step solutions with expert insights and AI powered tools for academic success

Step: 2

blur-text-image_2

Step: 3

blur-text-image_3

Ace Your Homework with AI

Get the answers you need in no time with our AI-driven, step-by-step assistance

Get Started

Recommended Textbook for

Advanced Stocks Analysis A Fundamentalist Approach

Authors: Luciano Storelli ,Storelli And Pepe Stocks Investments

1st Edition

979-8395523006

More Books

Students also viewed these Finance questions