

Question
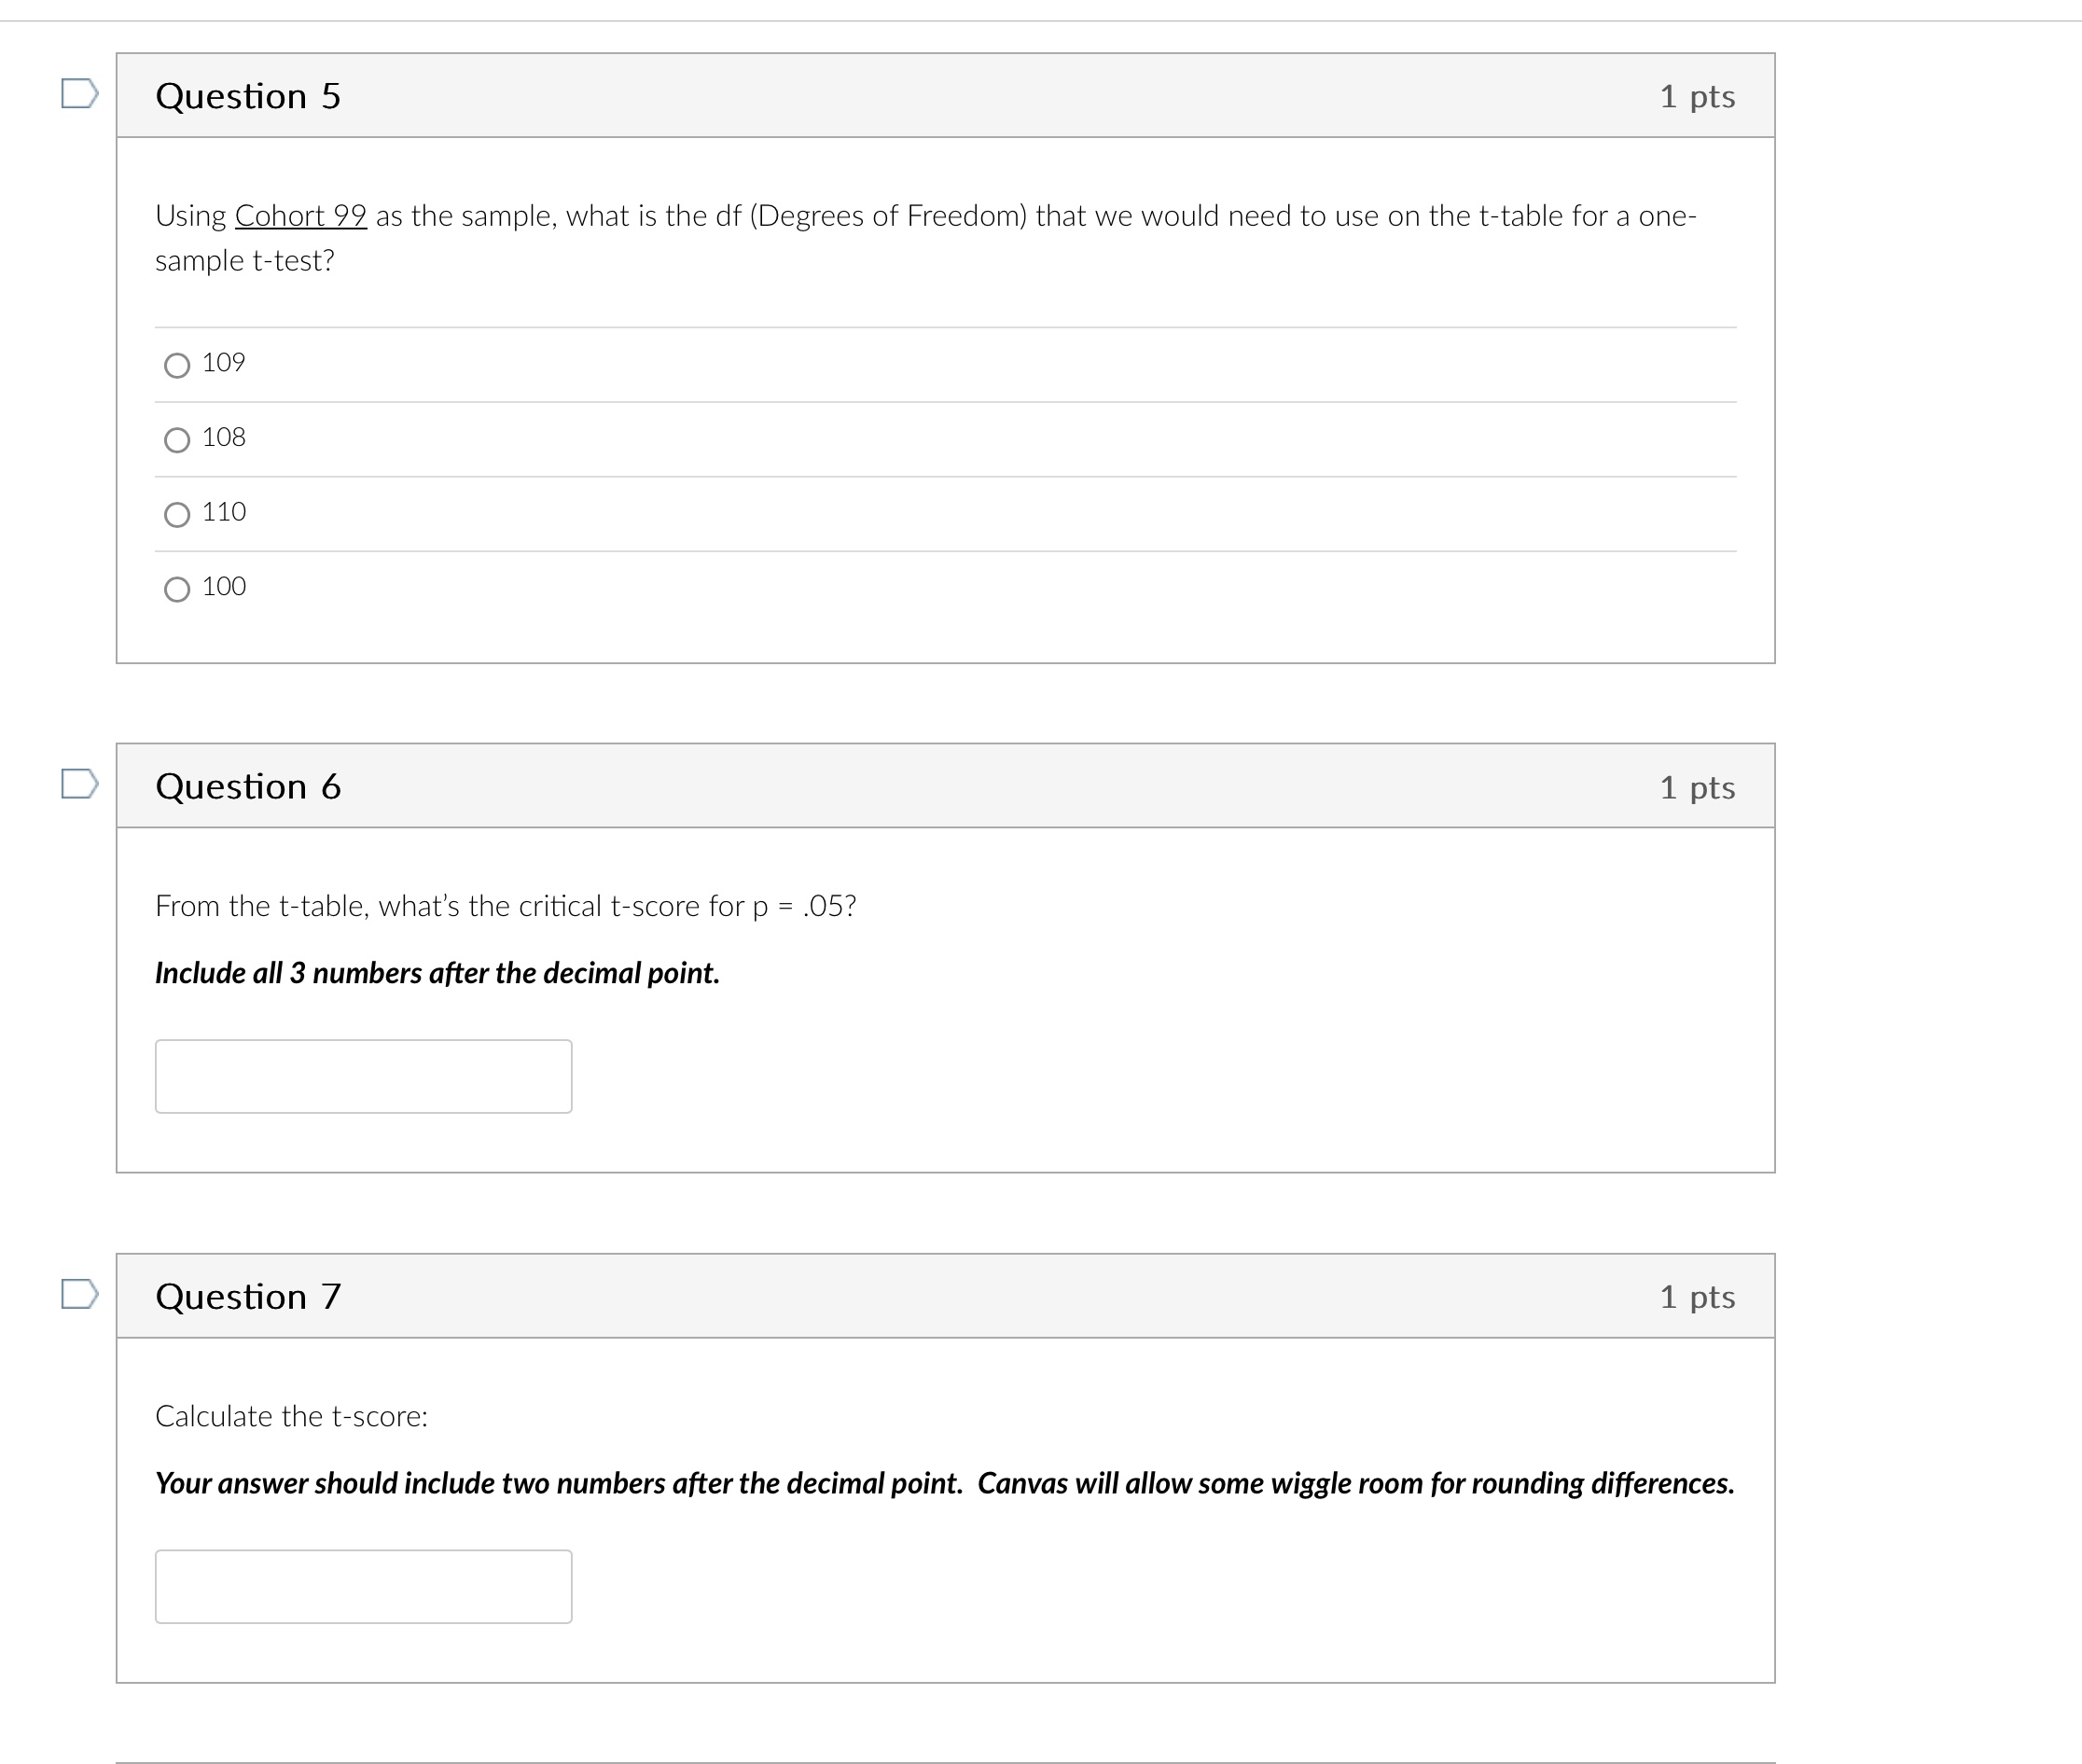
D Question 5 1 pts Using Cohort 92 as the sample, what is the df (Degrees of Freedom) that we would need to use on
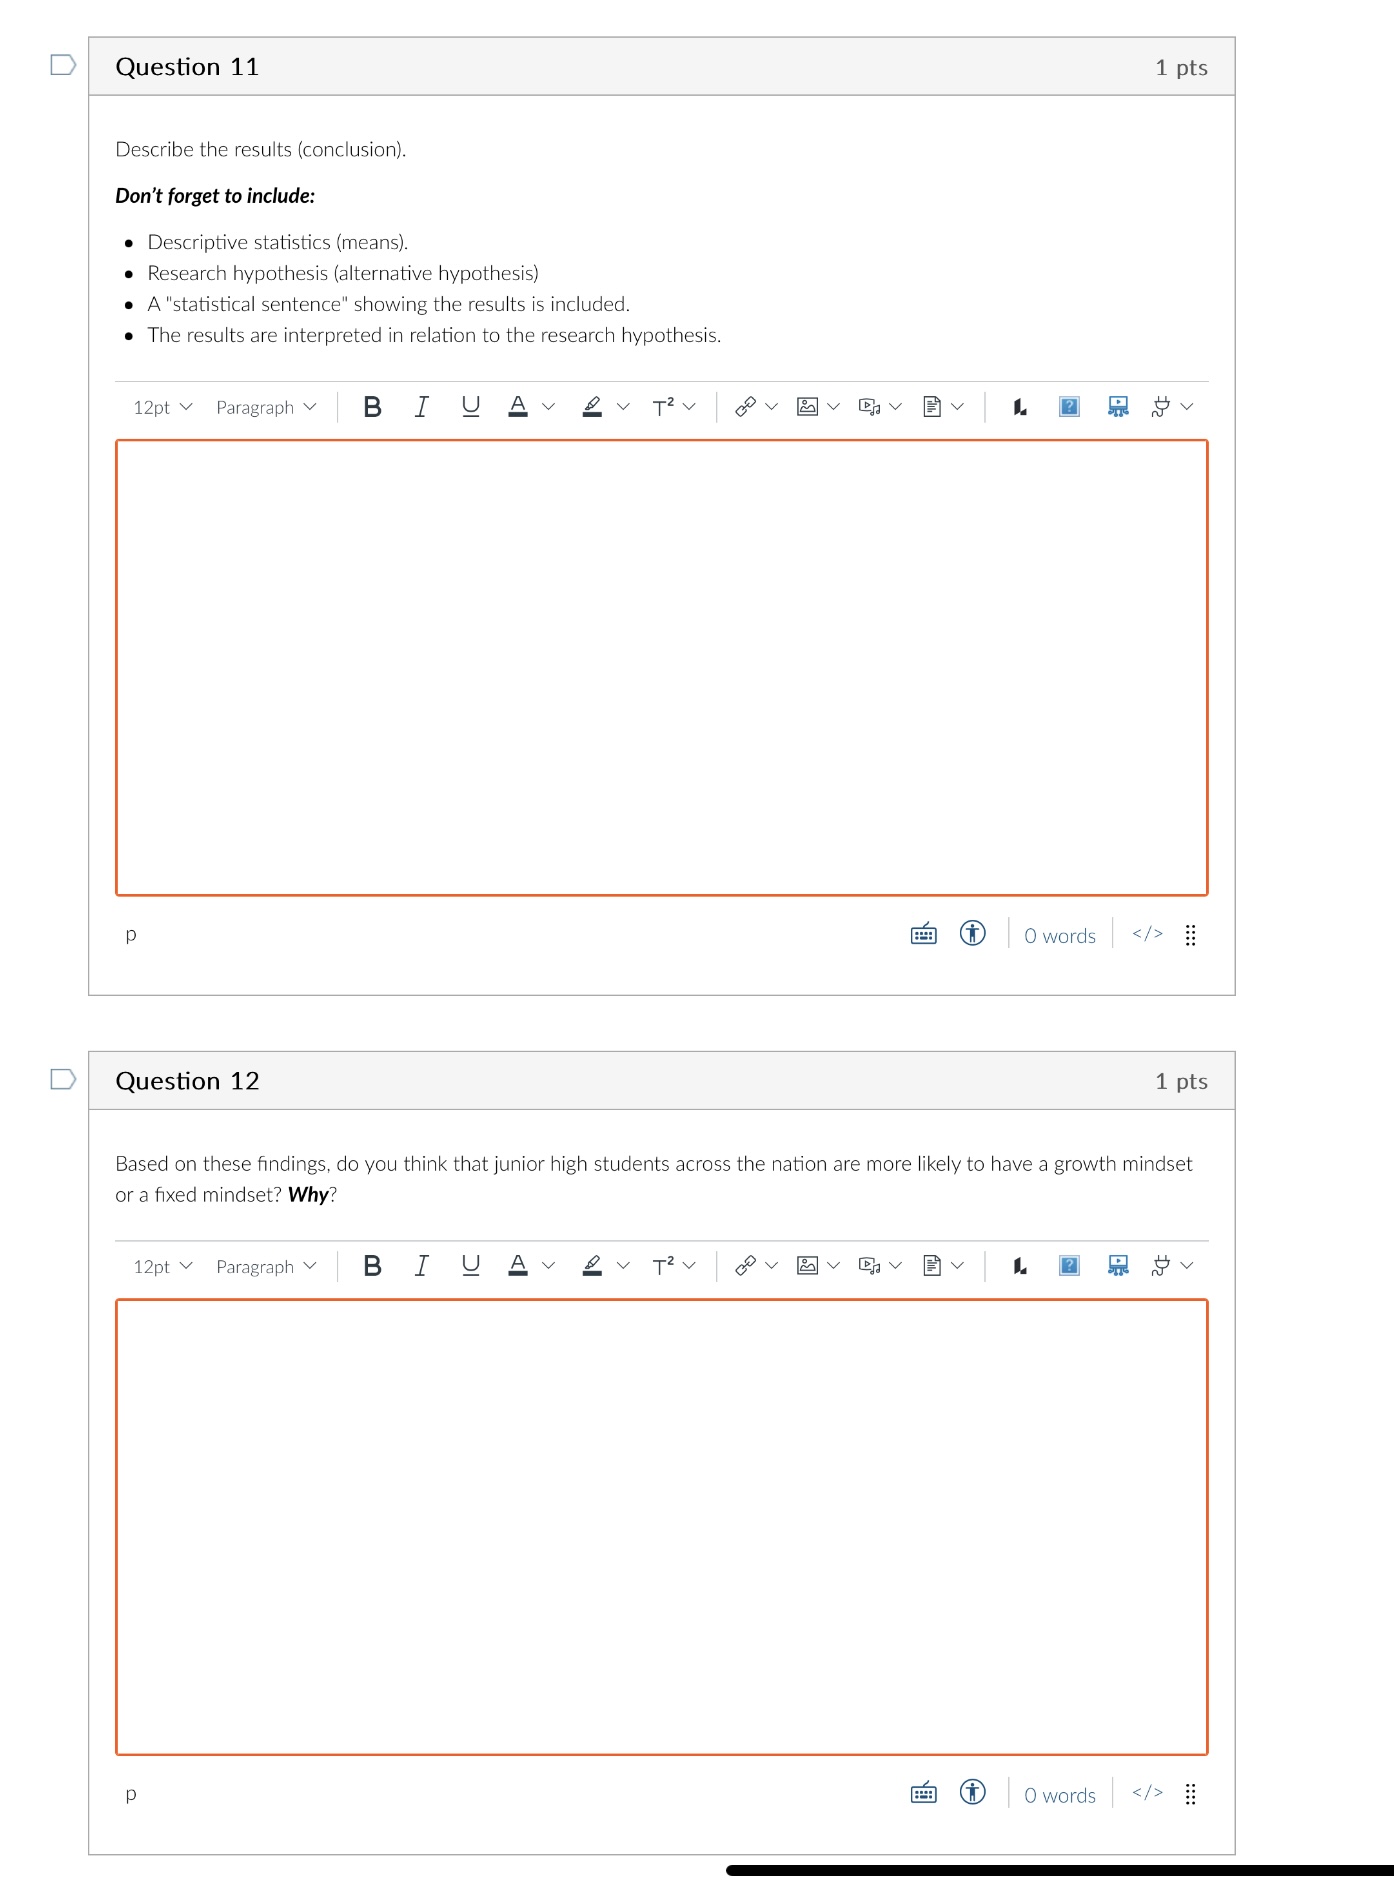
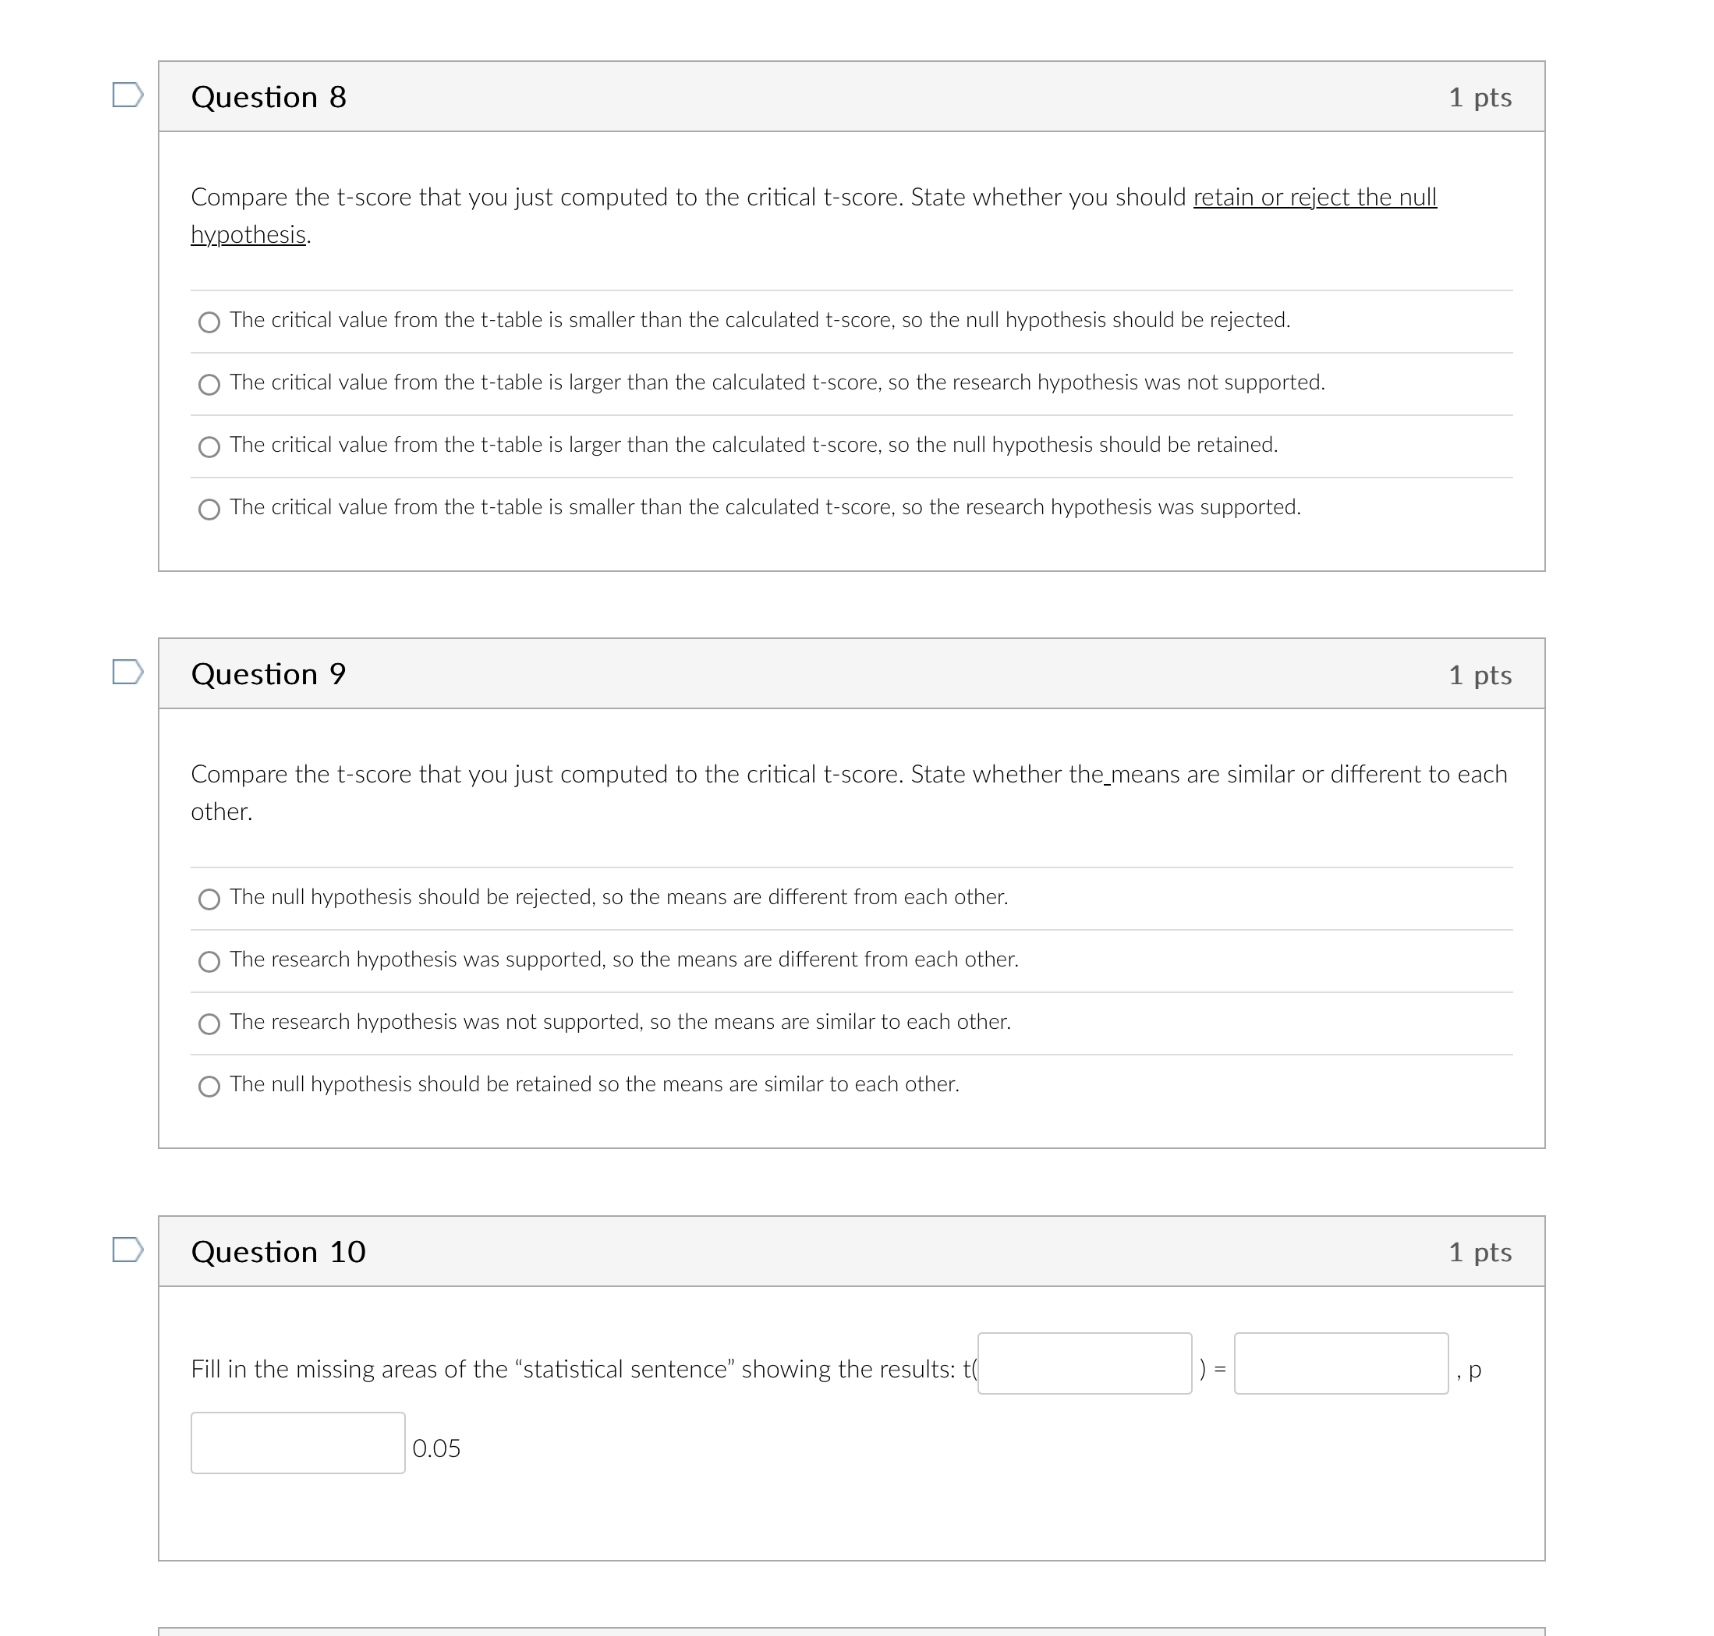
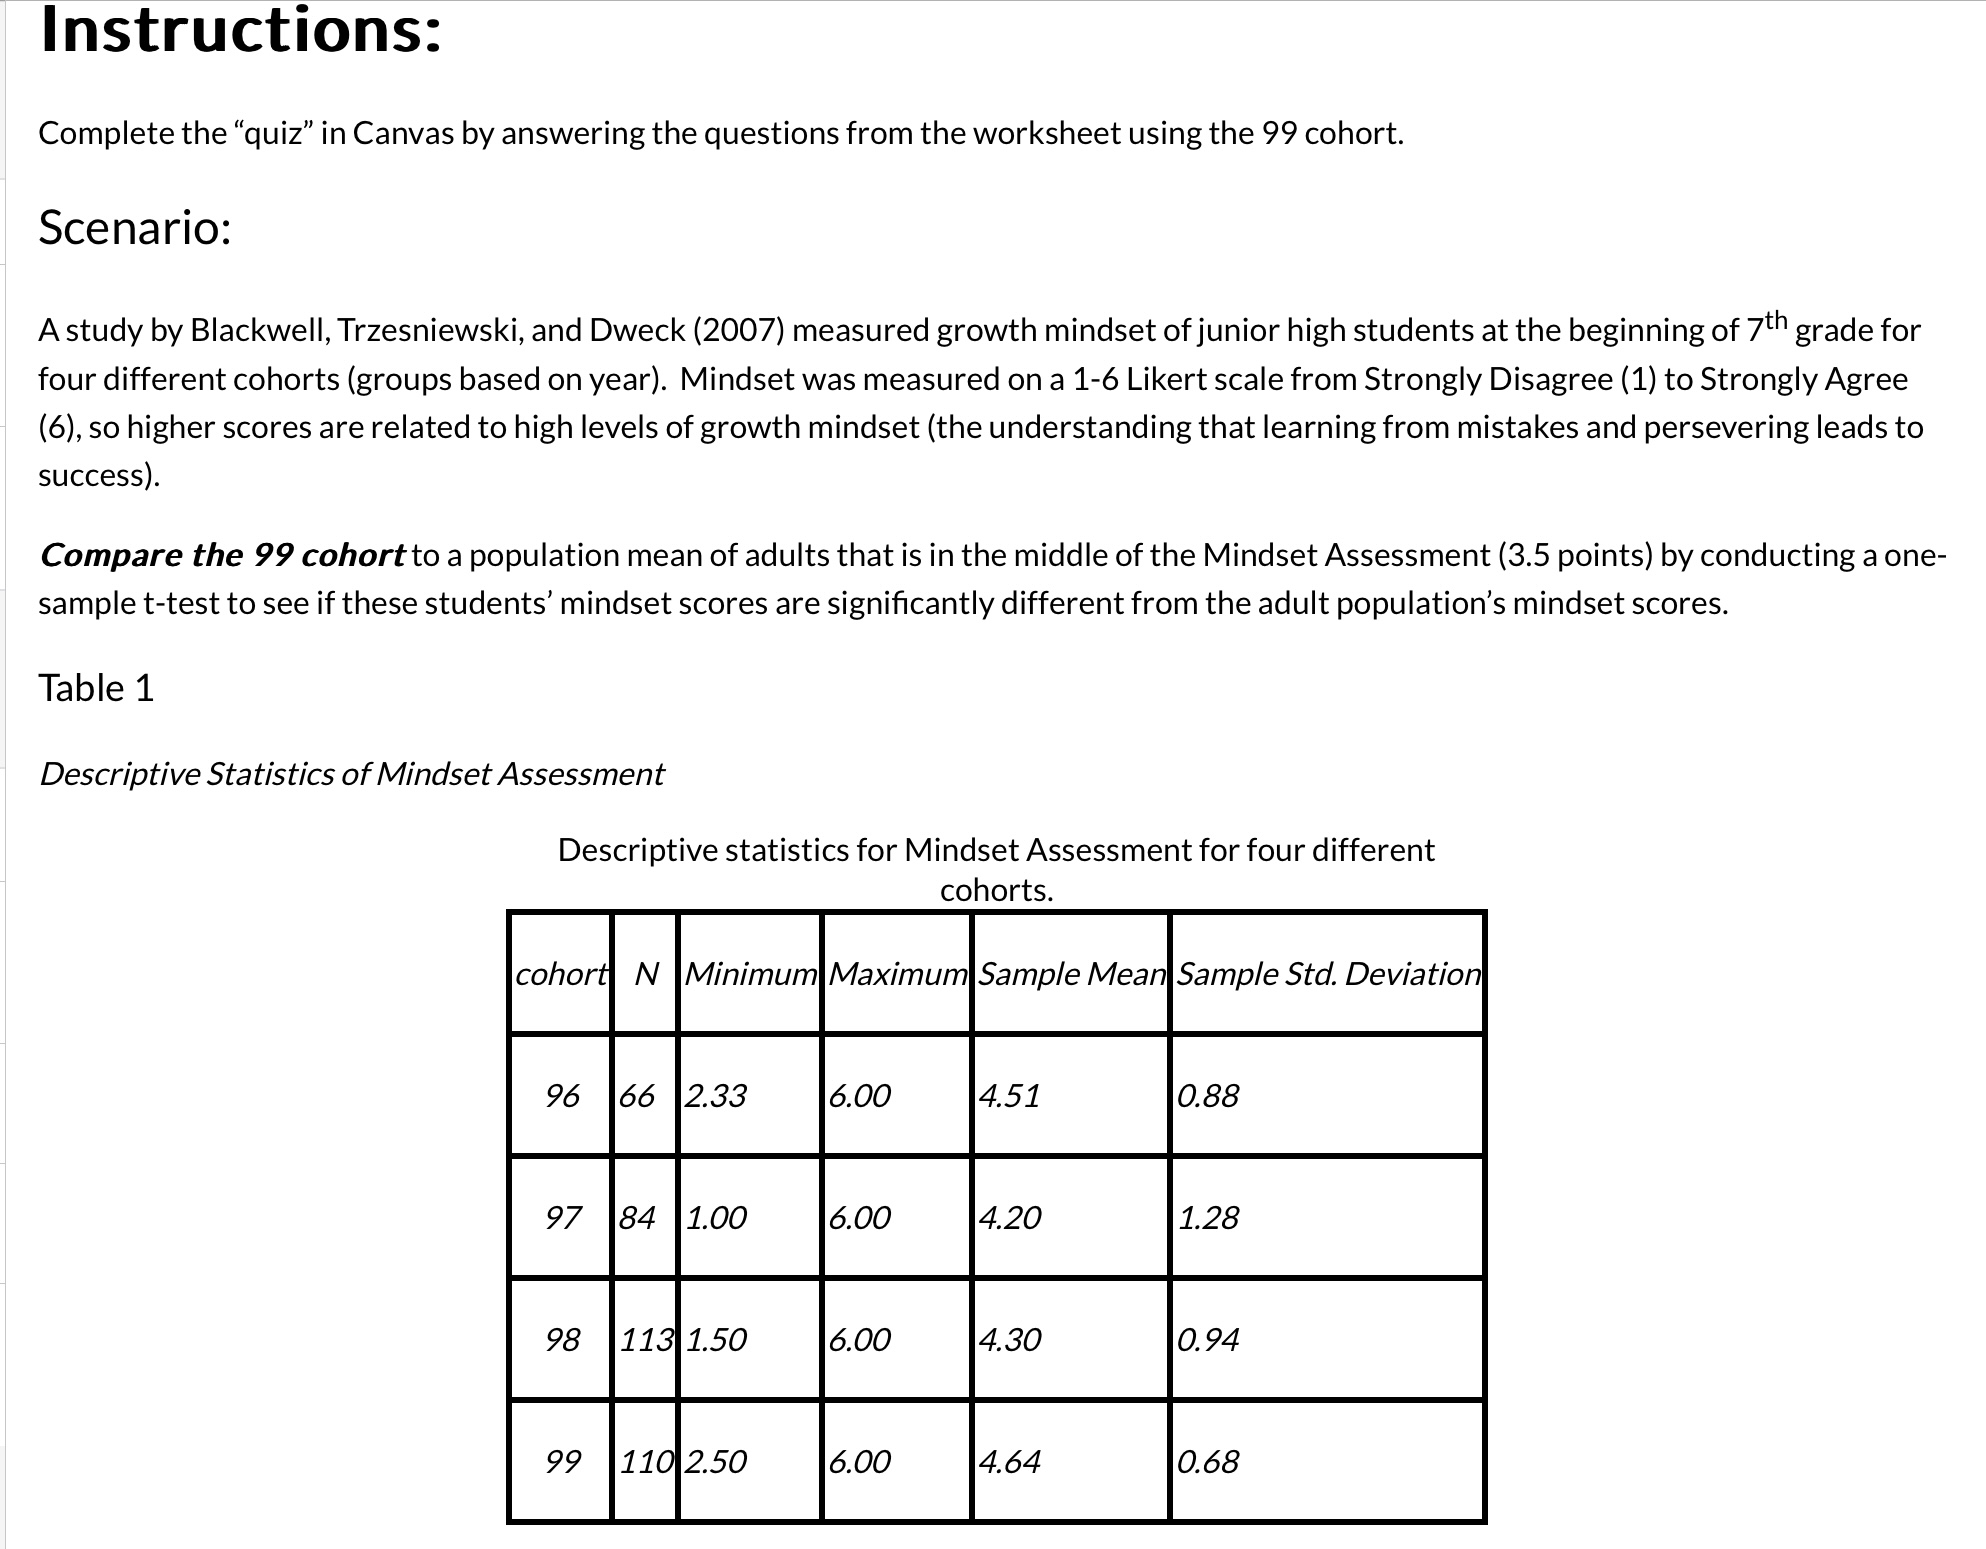
p D Question 11 1 pts Describe the results (conclusion). Don't forget to include: . Descriptive statistics (means). . Research hypothesis (alternative hypothesis) . A "statistical sentence" showing the results is included. The results are interpreted in relation to the research hypothesis. 12 pt v Paragraph " B I U A v & V T V Q V E V B BV L D RV ERCE + 0 words D Question 12 1 pts Based on these findings, do you think that junior high students across the nation are more likely to have a growth mindset or a fixed mindset? Why? 12pt V Paragraph B I U A V Q V T V Q V V Biv BV E253 + 0 words Question 8 1 pts Compare the t-score that you just computed to the critical t-score. State whether you should retain or reject the null hypothesis. (O The critical value from the t-table is smaller than the calculated t-score, so the null hypothesis should be rejected. (O The critical value from the t-table is larger than the calculated t-score, so the research hypothesis was not supported. O The critical value from the t-table is larger than the calculated t-score, so the null hypothesis should be retained. (O The critical value from the t-table is smaller than the calculated t-score, so the research hypothesis was supported. Question 9 1 pts Compare the t-score that you just computed to the critical t-score. State whether the_means are similar or different to each other. (O The null hypothesis should be rejected, so the means are different from each other. (O The research hypothesis was supported, so the means are different from each other. (O The research hypothesis was not supported, so the means are similar to each other. (O The null hypothesis should be retained so the means are similar to each other. Question 10 1 pts Fill in the missing areas of the \"statistical sentence\" showing the results: t( )= WP 0.05 Instructions: Complete the \"quiz\" in Canvas by answering the questions from the worksheet using the 99 cohort. Scenario: A study by Blackwell, Trzesniewski, and Dweck (2007) measured growth mindset of junior high students at the beginning of 7t" grade for four different cohorts (groups based on year). Mindset was measured on a 1-6 Likert scale from Strongly Disagree (1) to Strongly Agree (6), so higher scores are related to high levels of growth mindset (the understanding that learning from mistakes and persevering leads to success). Compare the 99 cohortto a population mean of adults that is in the middle of the Mindset Assessment (3.5 points) by conducting a one- sample t-test to see if these students' mindset scores are significantly different from the adult population's mindset scores. Table 1 Descriptive Statistics of Mindset Assessment Descriptive statistics for Mindset Assessment for four different cohorts. cohorty] N |Minimum|Maximum|Sample Mean|Sample Std. Deviation
Step by Step Solution
There are 3 Steps involved in it
Step: 1

Get Instant Access to Expert-Tailored Solutions
See step-by-step solutions with expert insights and AI powered tools for academic success
Step: 2

Step: 3
Ace Your Homework with AI
Get the answers you need in no time with our AI-driven, step-by-step assistance
Get Started
Linear Algebra and Its Applications
Authors: Gilbert Strang
4th edition
30105678, 30105676, 978-0030105678