Answered step by step
Verified Expert Solution
Question
1 Approved Answer
d. What is the excess margin as a percent of net revenues for each year? How does it compare to the Moodys 2019 Healthcare Median
d. What is the excess margin as a percent of net revenues for each year? How does it compare to the Moodys 2019 Healthcare Median of 4.6%?
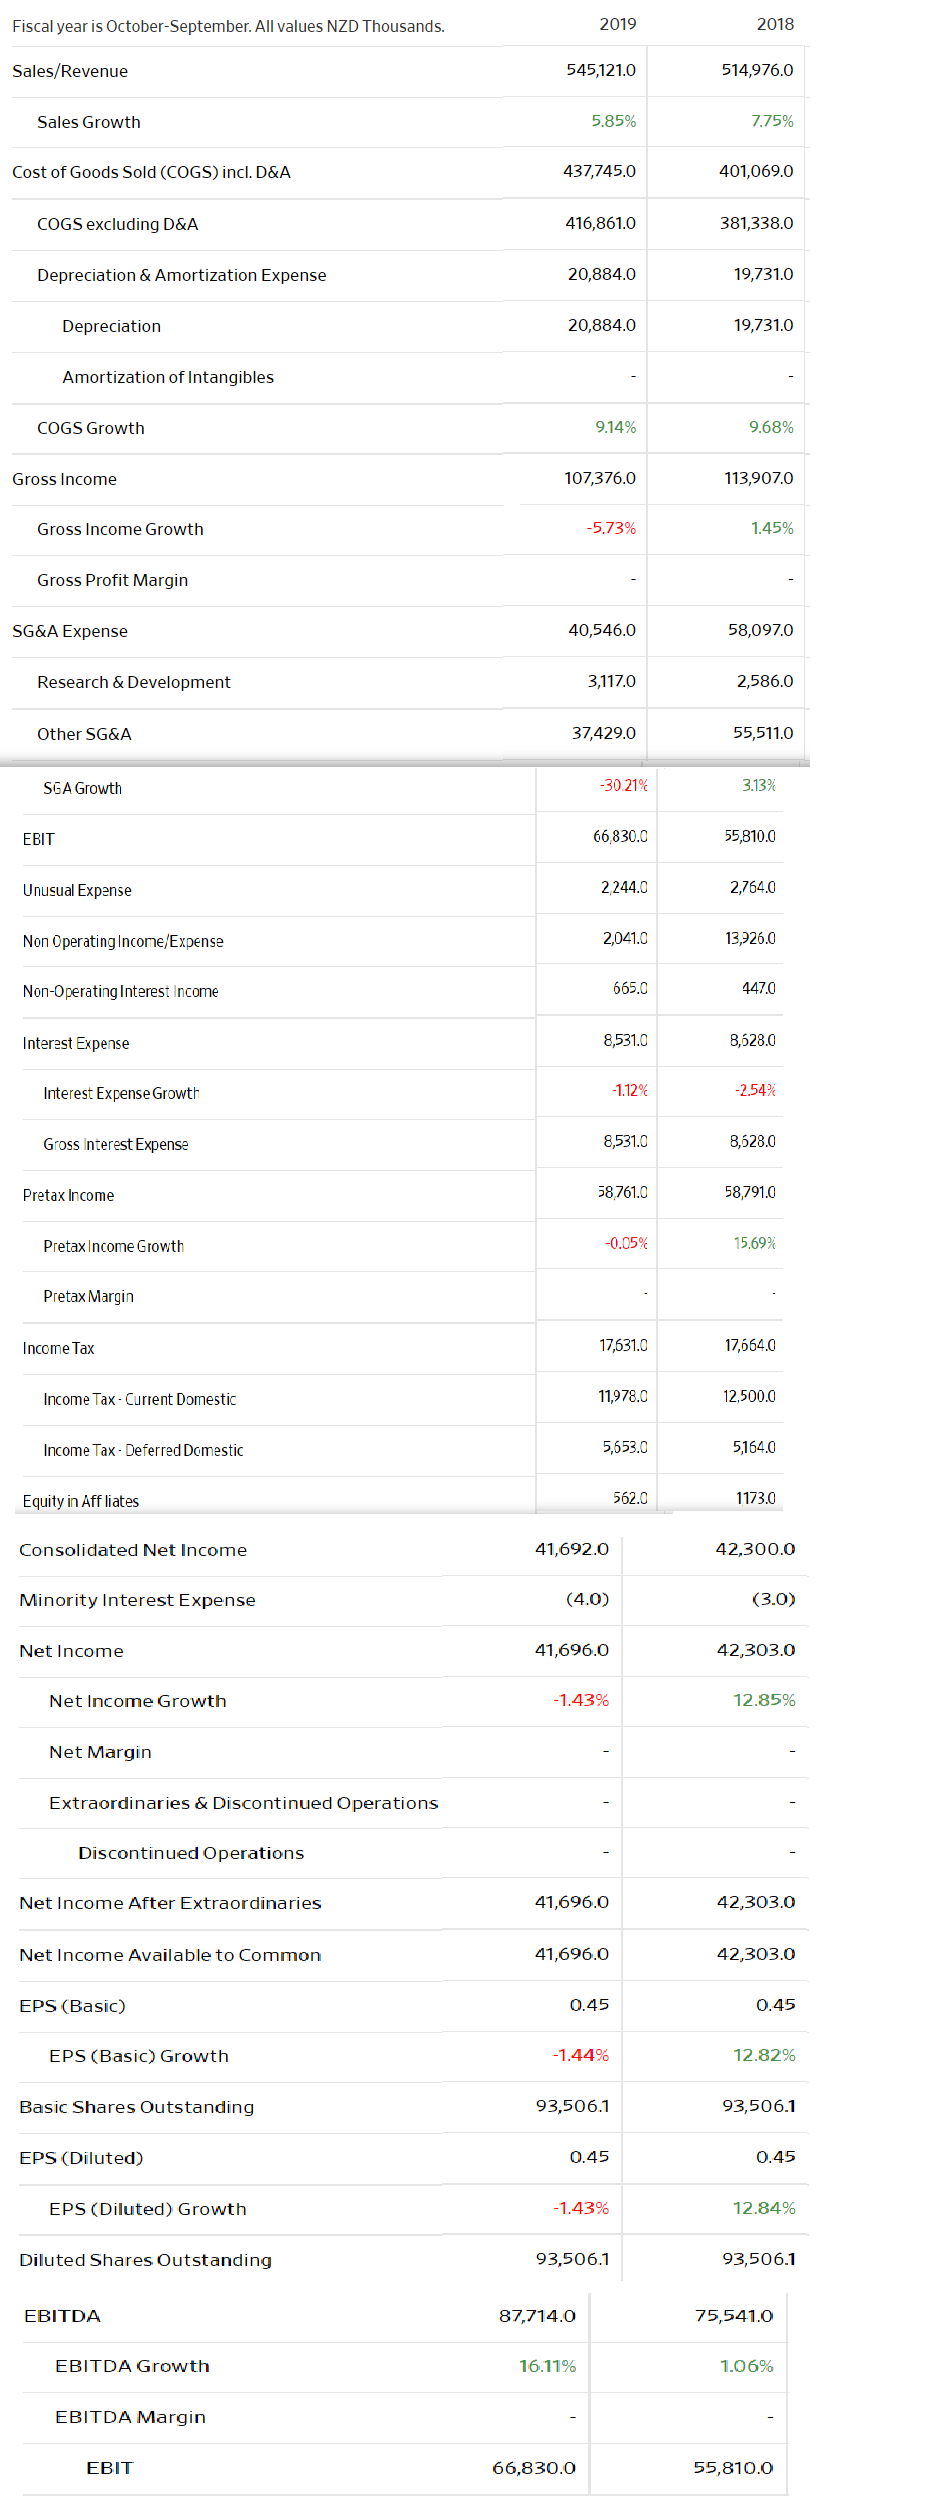
Fiscal year is October September. All values NZD Thousands. 2019 2018 Sales/Revenue 545,121.0 514,976.0 Sales Growth 5.85% 7.75% Cost of Goods Sold (COGS) incl. D&A 437,745.0 401,069.0 COGS excluding D&A 416,861.0 381,338.0 Depreciation & Amortization Expense 20,884.0 19,731.0 Depreciation 20,884.0 19,731.0 Amortization of Intangibles COGS Growth 9.14% 9.68% Gross Income 107,376.0 113,907.0 Gross Income Growth -5.73% 1.45% Gross Profit Margin SG&A Expense 40,546.0 58,097.0 Research & Development 3,117.0 2,586.0 Other SG&A 37,429.0 55,511.0 SGA Growth -30.21% 3.13% EBIT 66,830.0 55,810.0 Unusual Expense 2,244.0 2,764.0 Non Operating Income/Expense 2,041.0 13,926.0 Non-Operating Interest Income 665.0 447.0 Interest Expense 8,531.0 8,628.0 Interest Expense Growth -1.12% -2.54% Gross Interest Expense 8,531.0 8,628.0 Pretax Income 58,761.0 58,791.0 Pretax Income Growth -0.05% 15.69% Pretax Margin Income Tax 17,631.0 17,664.0 Income Tax - Current Domestic 11,978.0 12,500.0 Income Tax-Deferred Domestic 5,653.0 5164.0 Equity in Affliates 562.0 1173.0 Consolidated Net Income 41,692.0 42,300.0 Minority Interest Expense (4.0) (3.0) Net Income 41,696.0 42,303.0 Net Income Growth -1.43% 12.85% Net Margin Extraordinaries & Discontinued Operations Discontinued Operations Net Income After Extraordinaries 41,696.0 42,303.0 Net Income Available to Common 41,696.0 42,303.0 EPS (Basic) 0.45 0.45 EPS (Basic) Growth -1.44% 12.82% Basic Shares Outstanding 93,506.1 93,506.1 EPS (Diluted) 0.45 0.45 EPS (Diluted) Growth -1.43% 12.84% Diluted Shares Outstanding 93,506.1 93,506.1 EBITDA 87,714.0 75,541.0 EBITDA Growth 16.11% 1.06% EBITDA Margin EBIT 66,830.0 55,810.0 Fiscal year is October September. All values NZD Thousands. 2019 2018 Sales/Revenue 545,121.0 514,976.0 Sales Growth 5.85% 7.75% Cost of Goods Sold (COGS) incl. D&A 437,745.0 401,069.0 COGS excluding D&A 416,861.0 381,338.0 Depreciation & Amortization Expense 20,884.0 19,731.0 Depreciation 20,884.0 19,731.0 Amortization of Intangibles COGS Growth 9.14% 9.68% Gross Income 107,376.0 113,907.0 Gross Income Growth -5.73% 1.45% Gross Profit Margin SG&A Expense 40,546.0 58,097.0 Research & Development 3,117.0 2,586.0 Other SG&A 37,429.0 55,511.0 SGA Growth -30.21% 3.13% EBIT 66,830.0 55,810.0 Unusual Expense 2,244.0 2,764.0 Non Operating Income/Expense 2,041.0 13,926.0 Non-Operating Interest Income 665.0 447.0 Interest Expense 8,531.0 8,628.0 Interest Expense Growth -1.12% -2.54% Gross Interest Expense 8,531.0 8,628.0 Pretax Income 58,761.0 58,791.0 Pretax Income Growth -0.05% 15.69% Pretax Margin Income Tax 17,631.0 17,664.0 Income Tax - Current Domestic 11,978.0 12,500.0 Income Tax-Deferred Domestic 5,653.0 5164.0 Equity in Affliates 562.0 1173.0 Consolidated Net Income 41,692.0 42,300.0 Minority Interest Expense (4.0) (3.0) Net Income 41,696.0 42,303.0 Net Income Growth -1.43% 12.85% Net Margin Extraordinaries & Discontinued Operations Discontinued Operations Net Income After Extraordinaries 41,696.0 42,303.0 Net Income Available to Common 41,696.0 42,303.0 EPS (Basic) 0.45 0.45 EPS (Basic) Growth -1.44% 12.82% Basic Shares Outstanding 93,506.1 93,506.1 EPS (Diluted) 0.45 0.45 EPS (Diluted) Growth -1.43% 12.84% Diluted Shares Outstanding 93,506.1 93,506.1 EBITDA 87,714.0 75,541.0 EBITDA Growth 16.11% 1.06% EBITDA Margin EBIT 66,830.0 55,810.0Step by Step Solution
There are 3 Steps involved in it
Step: 1

Get Instant Access to Expert-Tailored Solutions
See step-by-step solutions with expert insights and AI powered tools for academic success
Step: 2

Step: 3
Ace Your Homework with AI
Get the answers you need in no time with our AI-driven, step-by-step assistance
Get Started