Answered step by step
Verified Expert Solution
Question
1 Approved Answer
D3duce a structur3 given the f0llowing dat4 and throughly explain the process of how the structur3 was d3duced, specifically including what data you used from
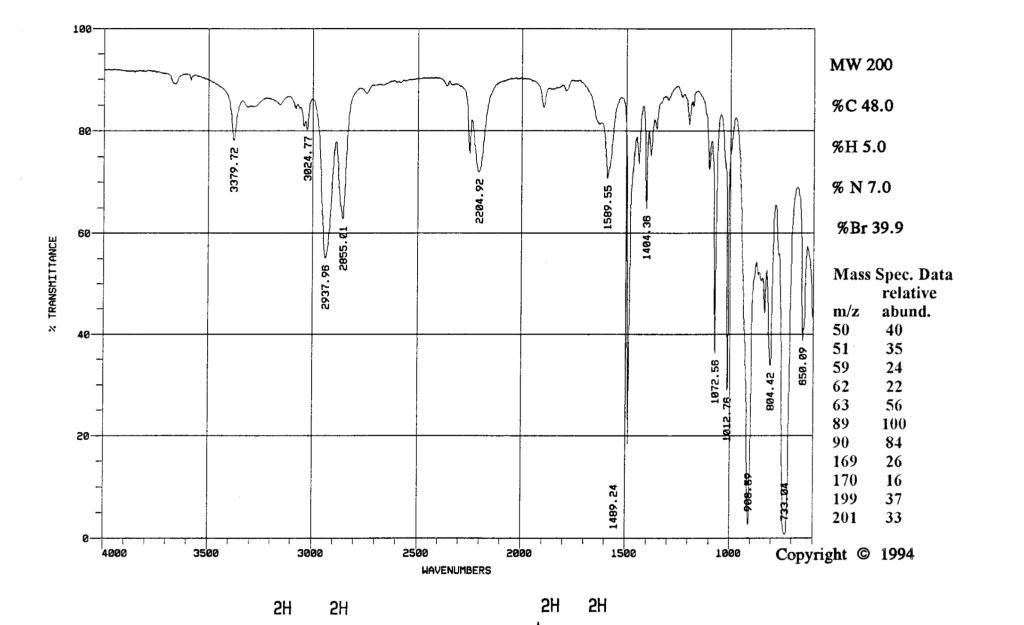
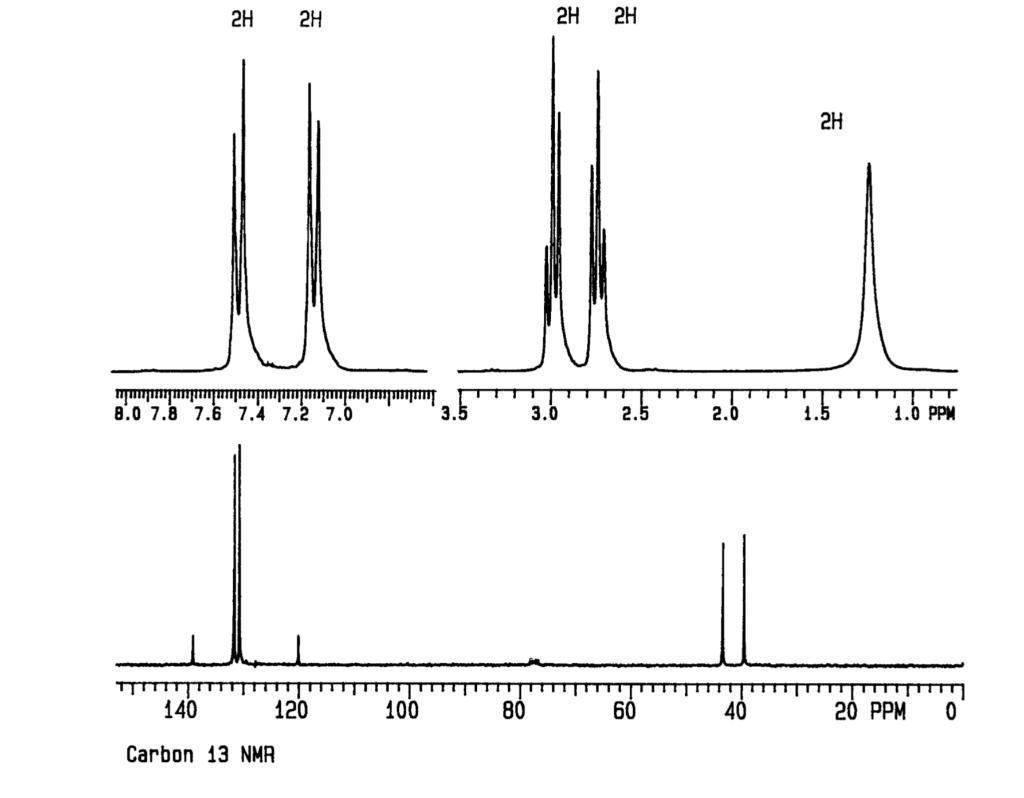
D3duce a structur3 given the f0llowing dat4 and throughly explain the process of how the structur3 was d3duced, specifically including what data you used from what Sp3ctras to get this answer.
I am tested on this process and am having quite a bit of trouble grasping it, please help figure out the structur3 mainly using the HNMR, CNMR, and IR data and explaining any use of the m4ss spectrometry and 3l3mental analysis on the rlght. 

Step by Step Solution
There are 3 Steps involved in it
Step: 1

Get Instant Access to Expert-Tailored Solutions
See step-by-step solutions with expert insights and AI powered tools for academic success
Step: 2

Step: 3

Ace Your Homework with AI
Get the answers you need in no time with our AI-driven, step-by-step assistance
Get Started


