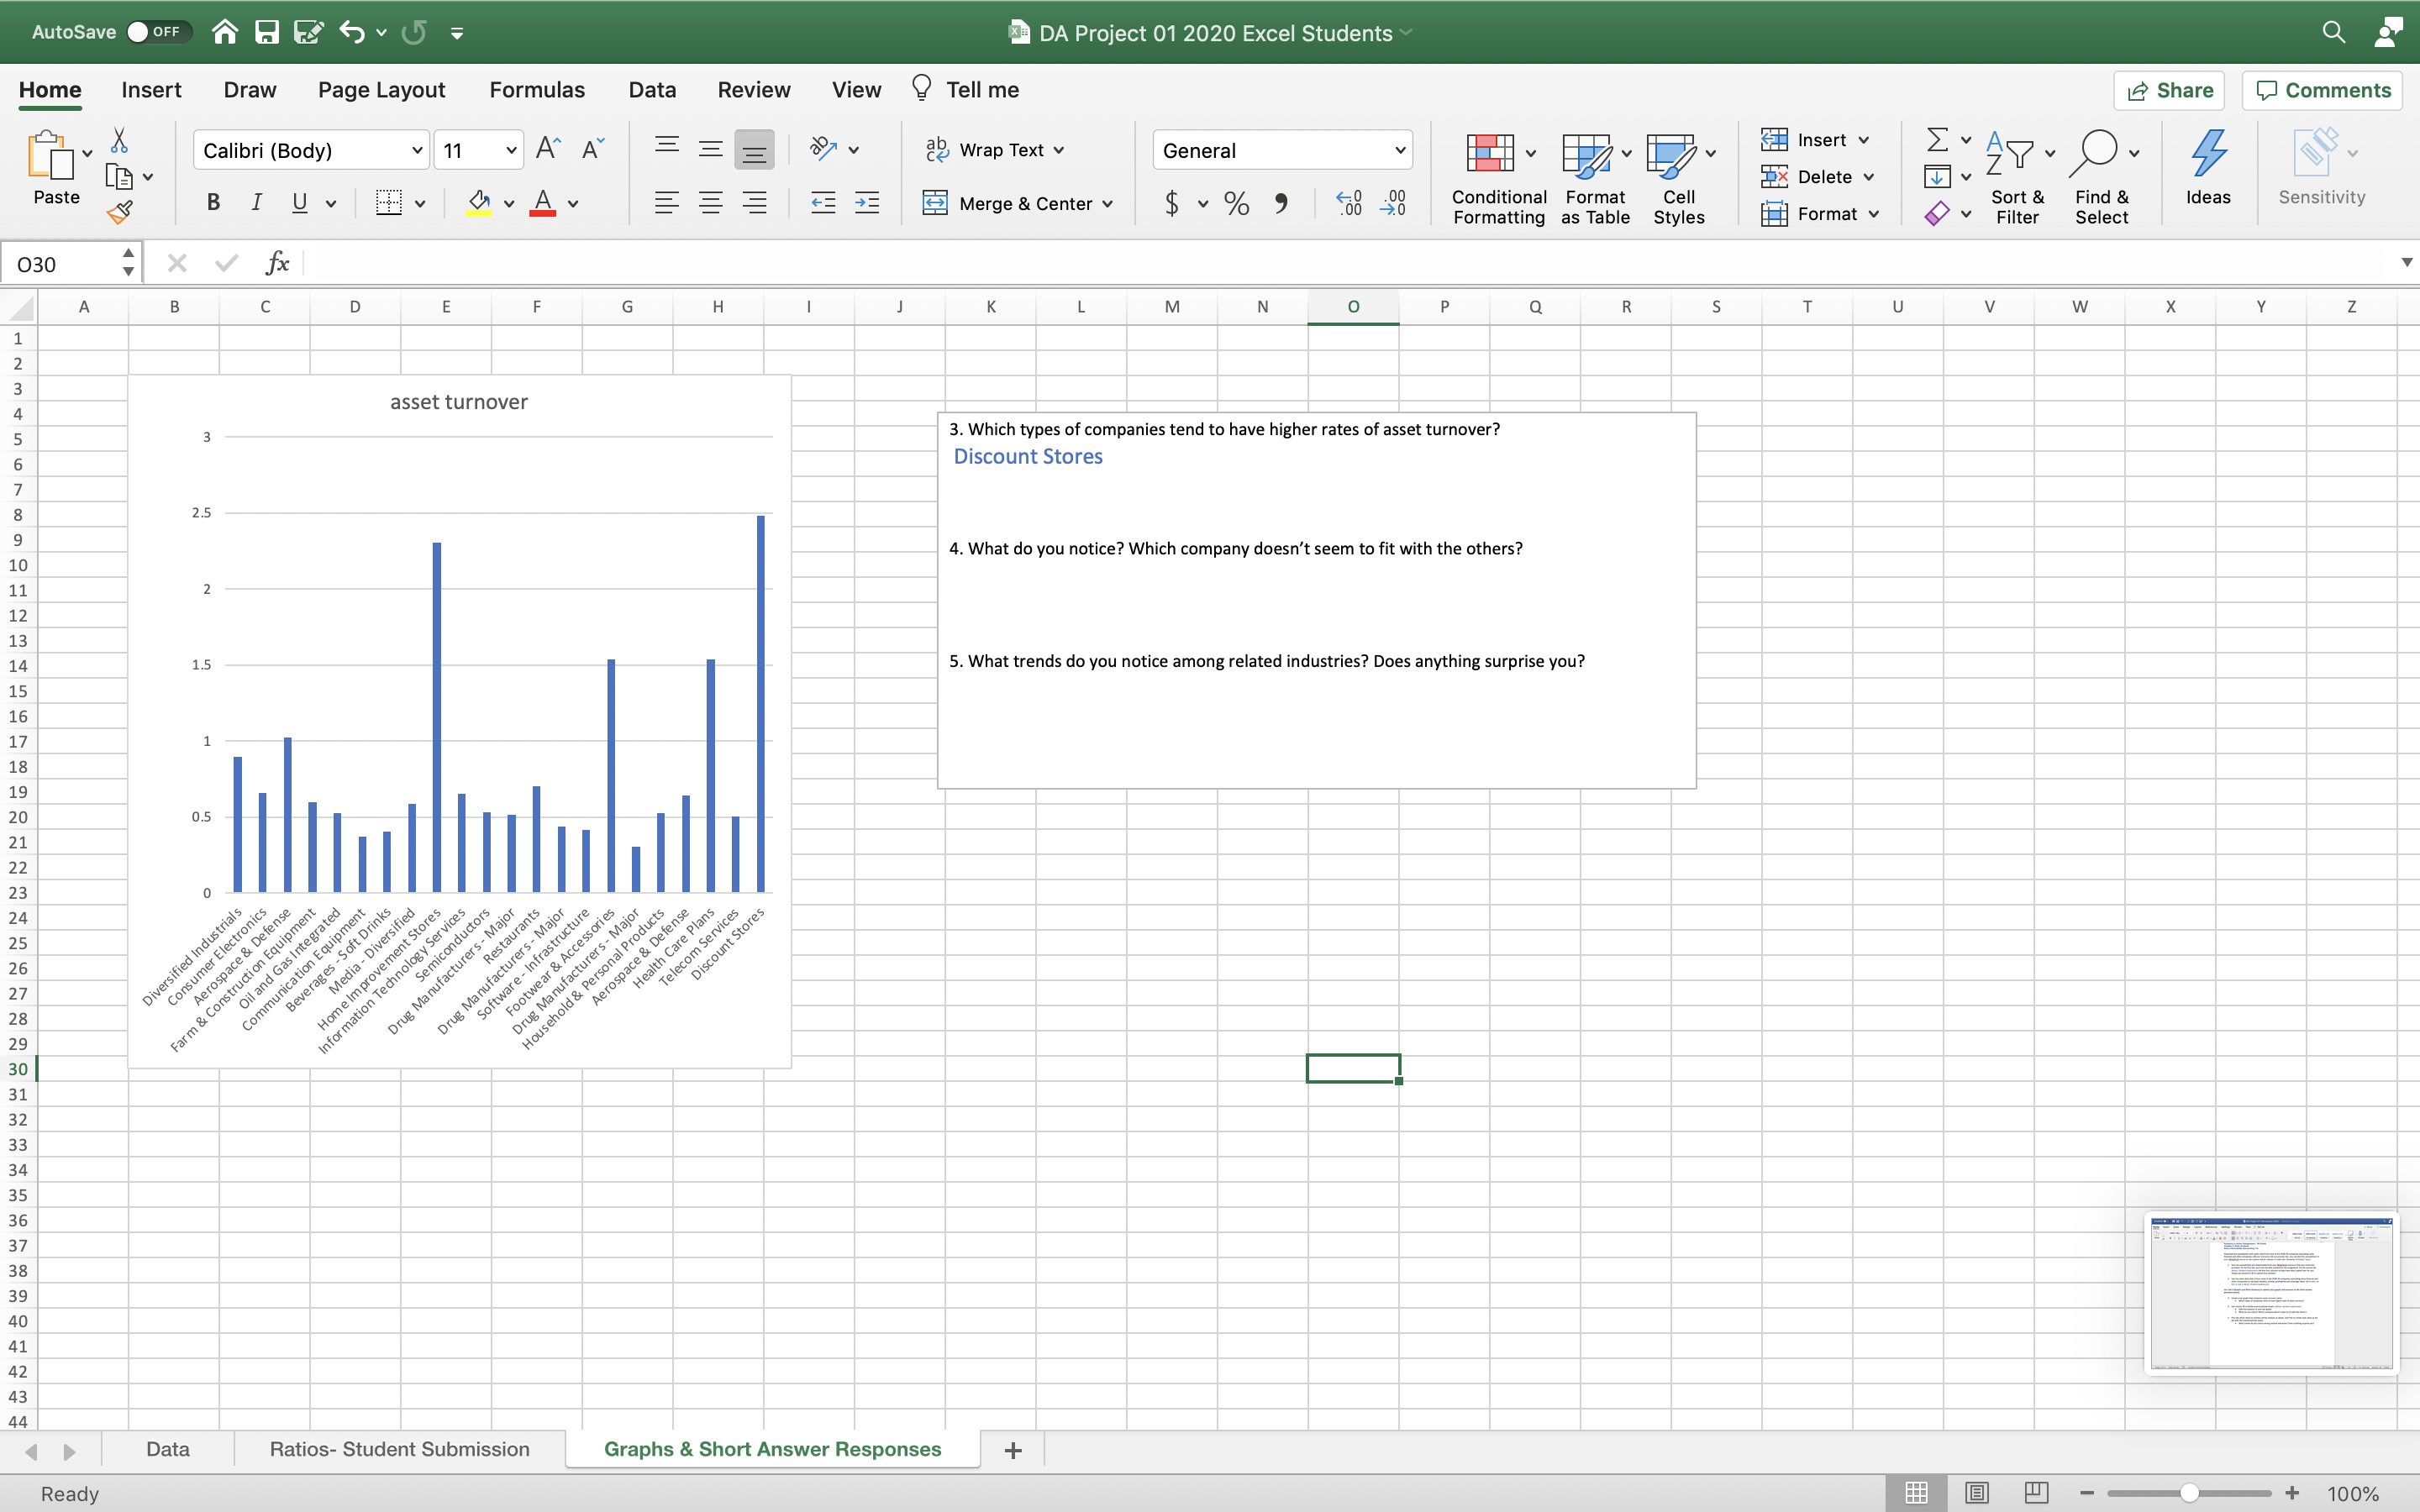
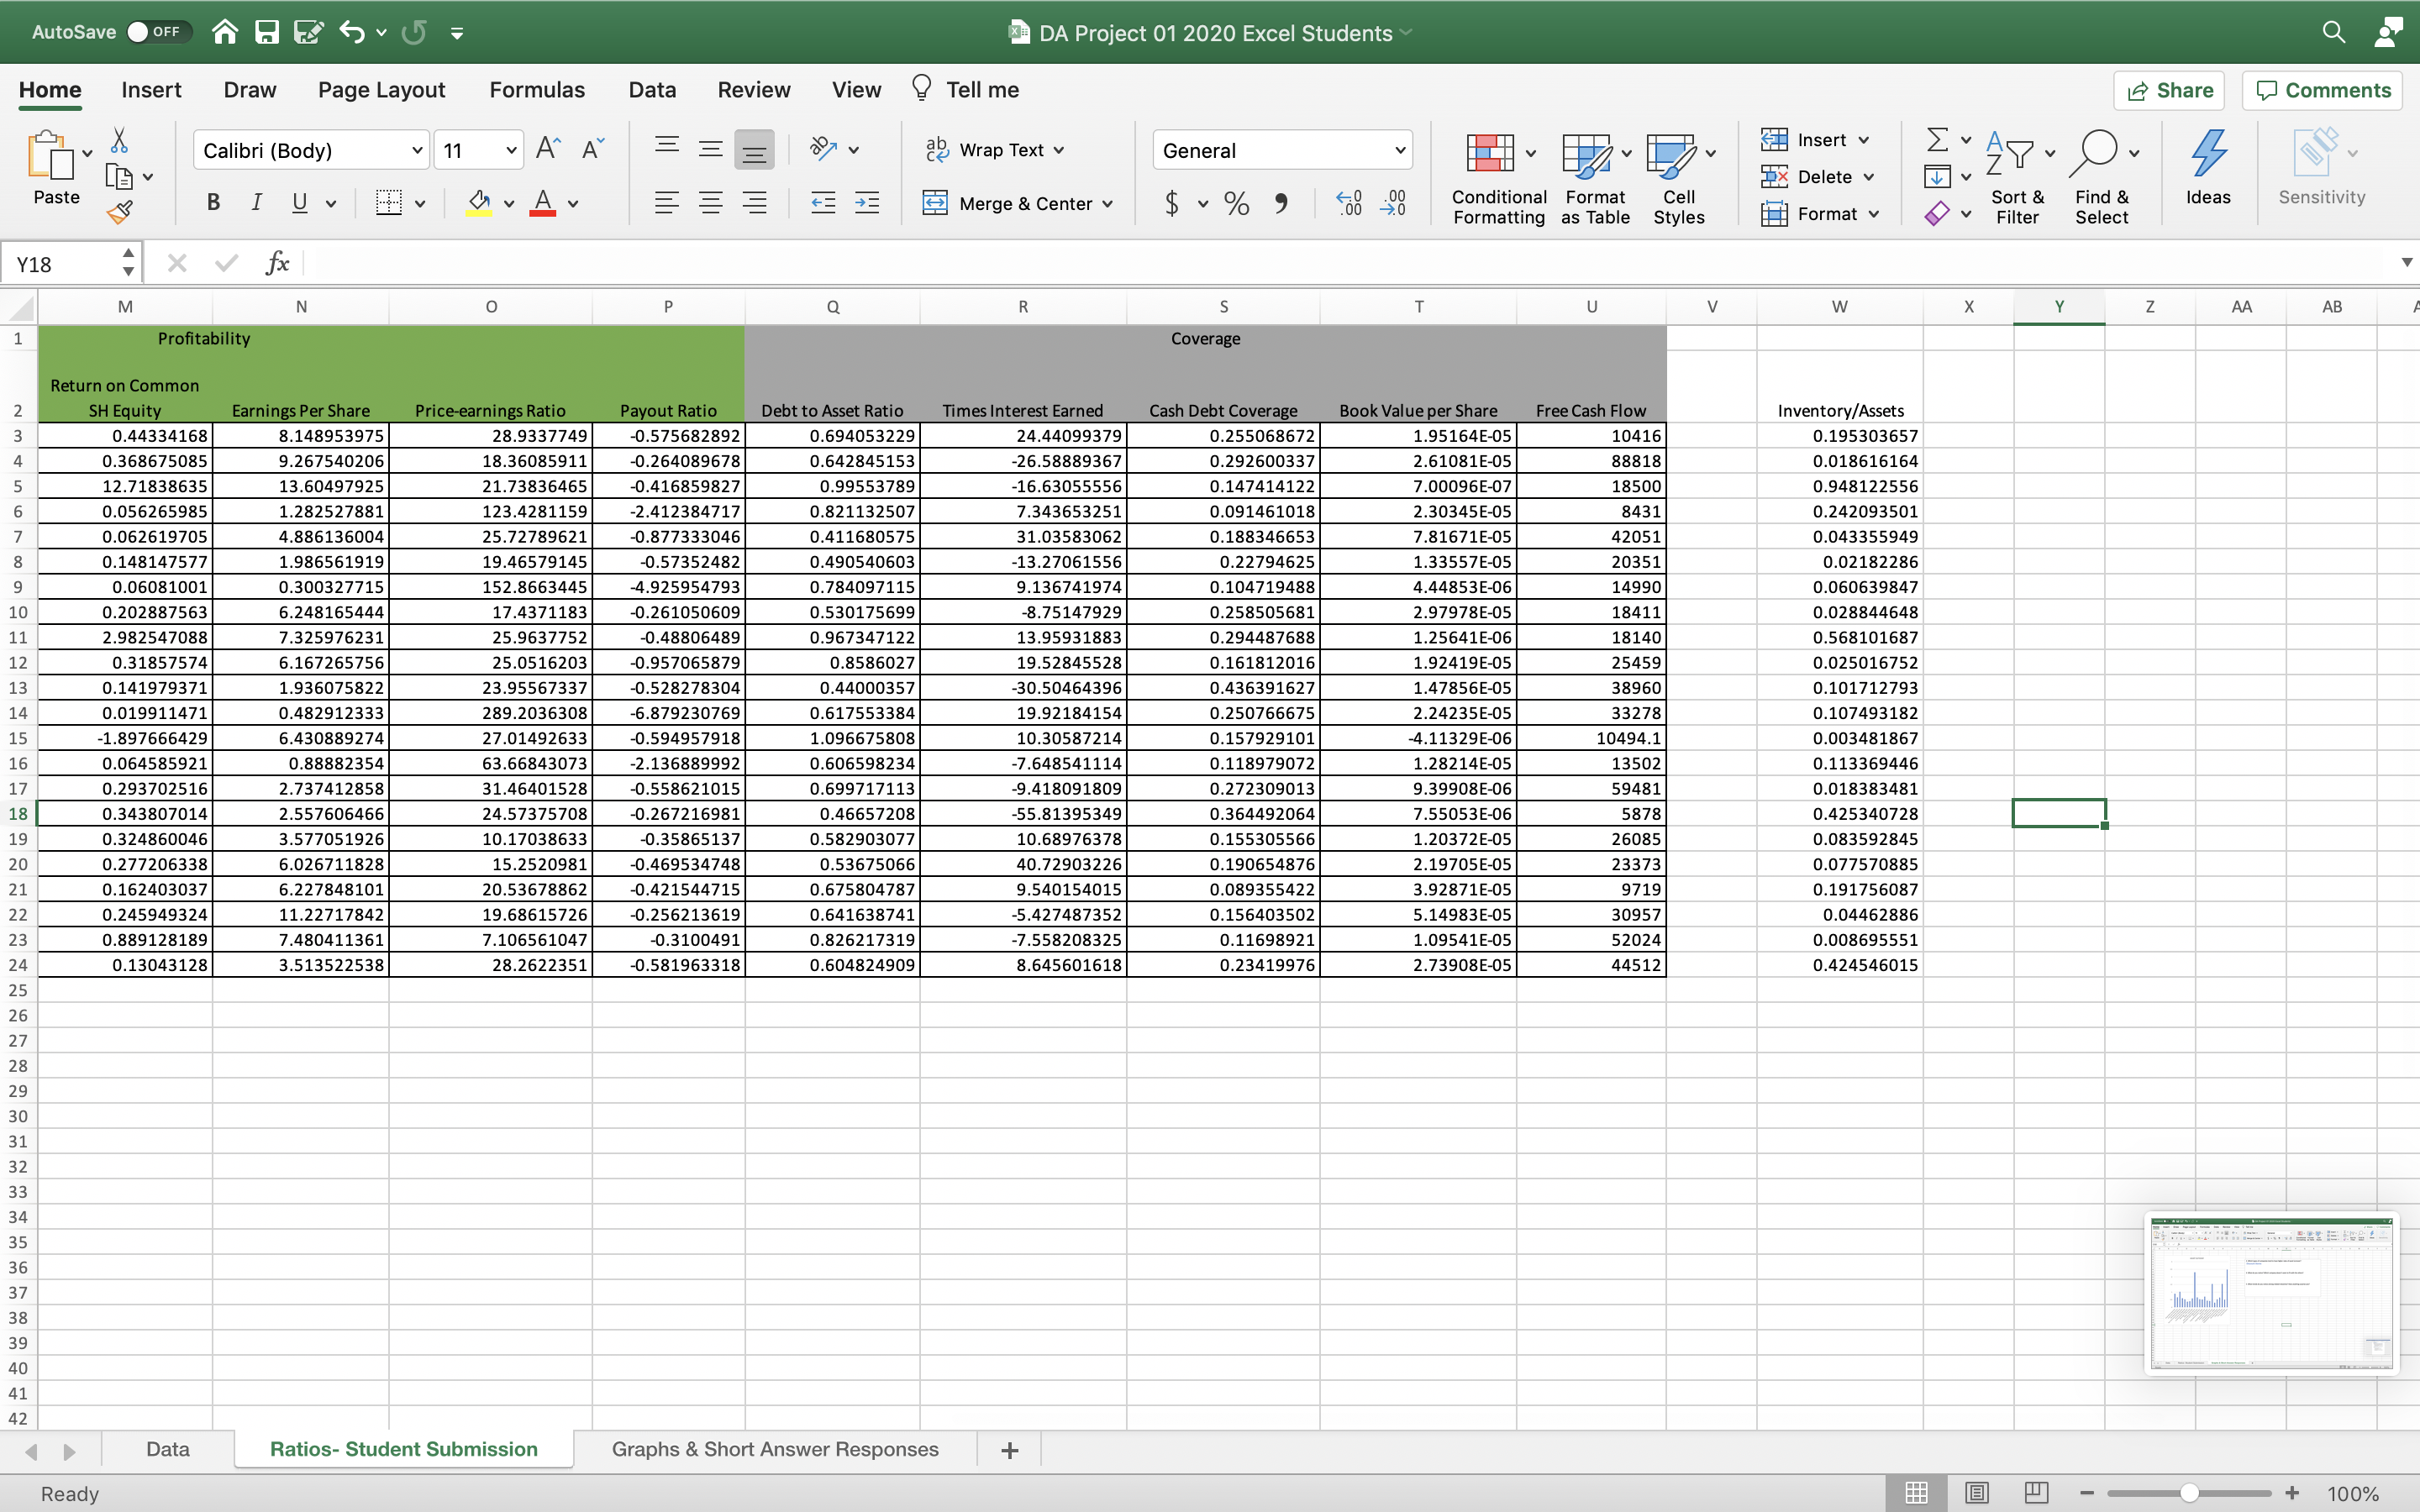
DA Project 01 instructions 2020 Home Insert Draw Design Layout References Mailings Review View 9 Tell me a Share 9 Comments x , . 7 . . ,2 t / la" v [a Calibri(eo.., vH 11 v A A Aa v A) \"21 A g\" 5 V Tl AaBchDdEe AaEbCCDdEe AaBchDt AaEchDdEt > A . " % V Paste 6 3 I g ., ab x2 x1 A V p v A ., W % _ Normal NoSPacing Hoading1 Headingz Styles Dictate Sensitivity , Pane Analytics in Action Assignment - 50 Points Chapter 5- Ratio Analysis Kieso Intermediate Accounting 11c Download the spreadsheet with select data from most of the DOW 30 companies (excluding some financial and other companies) (If your instructor did not provide this, you can find this spreadsheet in your W course on the explore tab for chapter 5 under the \"Analytics in Action\" icon.) 1. Save the spreadsheet you downloaded from your Wcourse or that your instructor provided. On the first tab, you'll see the data needed for this assignment. 0n the second tab (Ratios- Student Submission) the first four columns of data have been copied over for you. Please use columns E-W to submit your answers. 2. Use the select data (tab 1) from most of the DOW 30 companies (excluding some financial and other companies) to calculate liquidity, activity. profitability and coverage ratios. (Reminder, do this on tab 2-Ratios- Student Submission) Use Tab 3 (Graphs and Short Answers) to submit your graphs and answers to the short answer questions below. 3. Create a bar graph that compares asset turnover ratios. - which types of companies tend to have higher rates of asset turnover? 4. Use column W to divide inventory/total assets. (Ratios- Student Submission) I Add this measure to your bar graph. 0 What do you notice? Which company doesn't seem to fit with the others? 5. Pick two other ratios to conduct similar analysis as above. Feel free to create new ratios as we did with the inventory/total assets. 0 What trends do you notice among related industries? Does anything surprise you? Page'l oil 260 words U3 English (United States) D Focus u 5% _J + 122% AutoSave OFF DA Project 01 2020 Excel Students Home Insert Draw Page Layout Formulas Data Review View Tell me Share Comments Calibri (Body) v 11 AA ab Wrap Text General Insert v Ex Delete v LY AP- O. Paste BIUV DVAv E Merge & Center v $ ~ % " Conditional Format Cell Sort & Find & Ideas Formatting as Table Styles Format v Sensitivity Filter Select 030 fx B C D E F G H 1 J K L M N P Q R S T U V W X Z N N E 5 6 O V MI UI A W N H asset turnover 3. Which types of companies tend to have higher rates of asset turnover? Discount Stores 2.5 4. What do you notice? Which company doesn't seem to fit with the others? 1.5 5. What trends do you notice among related industries? Does anything surprise you? 18 19 20 Soft Drink Restaurants lecom Services Int Stores Consumer Electronics Aerospace & Defense Media - Diversified Semiconductors nufacturers - Major Personal Products Ith Care P Diversified Indust Communication Equipment Aerospace & Defense Oil and Gas Integr Home Improvement Stores Beverages - So for mation Technology Services Footwear & Accessories arm & Construction Equipment Software - Infrastructure Drug Manufacturers - Major Drug Manufacturers - Major Discount : ! Drug Househ 30 31 37 38 39 40 41 D Data Ratios- Student Submission Graphs & Short Answer Responses + Ready + 100%AutoSave OFF DA Project 01 2020 Excel Students Home Insert Draw Page Layout Formulas Data Review View Tell me Share Comments Calibri (Body) v 11 AA ab Wrap Text General Insert v x Delete v Ex AP - O. Paste BIUV E Merge & Center v $ ~ % " Conditional Format Cell Formatting as Table Styles Format v Sort & Find & Ideas Sensitivity Filter Select Y18 fx M N 0 P Q R W X AA AB Profitability Coverage Return on Common SH Equity Earnings Per Share Price-earnings Ratio Payout Ratio Debt to Asset Ratio Times Interest Earned Cash Debt Coverage Book Value per Share Free Cash Flow Inventory/Assets 0.4433416 8.148953975 28.9337749 0.575682892 0.694053229 24.44099379 0.255068672 1.95164E-05 0.195303657 0.368675085 9.267540206 18.3608591 0.264089678 .642845153 26.58889367 0.292600337 2.61081E-05 0.018616164 12.7183863 13.60497925 21.73836465 -0.416859827 0.99553789 16.63055556 0.147414122 7.00096E-07 18500 0.948122556 0.05626598 1.28252788 123.4281159 2.412384717 0.821132507 .343653251 0.091461018 .30345E-05 .242093501 0.062619705 .886136004 5.72789621 0.877333046 .411680575 1.03583062 .188346653 .81671E-O 0.043355949 0.148147577 1.986561919 -0.57352482 .490540603 13.27061556 0.22794625 .33557E-05 0.02182286 0.06081001 0.300327715 152.8663445 4.925954793 0.784097115 .136741974 0.104719488 4.44853E-06 .060639847 0.202887563 6.248165444 17.4371183 0.261050609 0.530175699 -8.75147929 .258505681 2.97978E-05 18411 0.028844648 2.98254708 7.325976231 25.9637752 -0.48806489 .967347122 13.95931883 0.294487688 1.25641E-0 0.568101687 0.31857574 5.16726575 25.0516203 0.957065879 0.8586027 19.52845528 .161812016 1.92419E-05 25459 0.02501675 .141979371 1.936075822 23.95567337 0.528278304 0.44000357 30.50464396 0.436391627 .47856E-05 38960 .101712793 0.019911471 0.482912333 89.2036308 6.879230769 0.617553384 19.92184154 0.250766675 .242356-05 0.107493182 1.897666429 5.430889274 27.01492633 0.594957918 1.096675808 10.30587214 .157929101 4.11329E-06 0494.1 0.003481867 0.064585921 0.88882354 63.66843073 2.136889992 0.606598234 7.648541114 .118979072 .28214E-05 13502 3369446 0.29370251 2.737412858 1.46401528 0.558621015 .699717113 9.418091809 0.272309013 .39908E-06 59481 .01838348 0.343807014 2.557606466 24.57375708 .267216981 0.46657208 55.81395349 0.364492064 .55053E-06 5878 0.425340728 0.32486004 .57705192 10.1703863 0.35865137 .582903077 10.68976378 0.155305566 .20372E-05 0.083592845 0.277206338 5.026711828 15.2520981 0.469534748 0.53675066 10.72903226 0.190654876 2.19705E-05 13373 0.077570885 0.162403037 6.227848101 20.53678862 0.421544715 .67580478 9.540154015 0.089355422 3.92871E-05 .191756087 0.245949324 1.22717842 19.68615726 -0.256213619 0.64163874 5.427487352 .156403502 5.14983E-05 0.04462886 0.889128189 .480411361 7.106561047 -0.3100491 0.826217319 7.558208325 0.11698921 1.09541E-05 .008695551 0.13043128 3.513522538 28.2622351 -0.581963318 0.604824909 8.645601618 0.23419976 2.73908E-05 0.424546015 26 28 30 36 37 38 39 40 41 42 Data Ratios- Student Submission Graphs & Short Answer Responses + Ready +