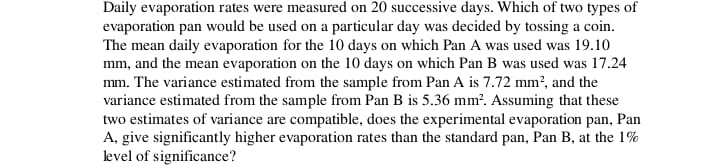
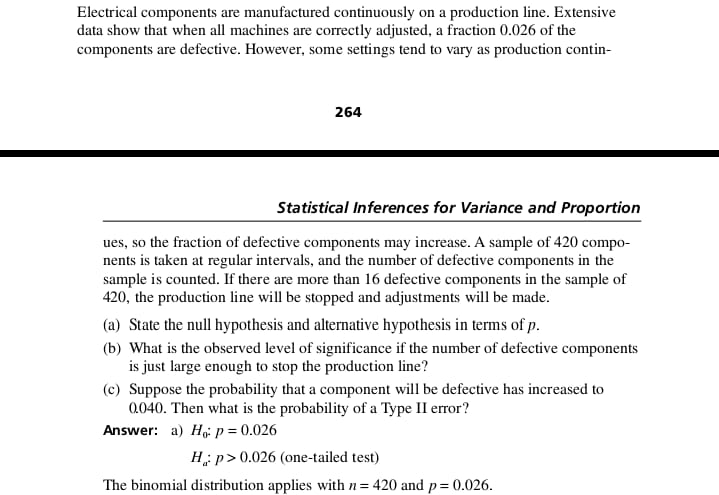
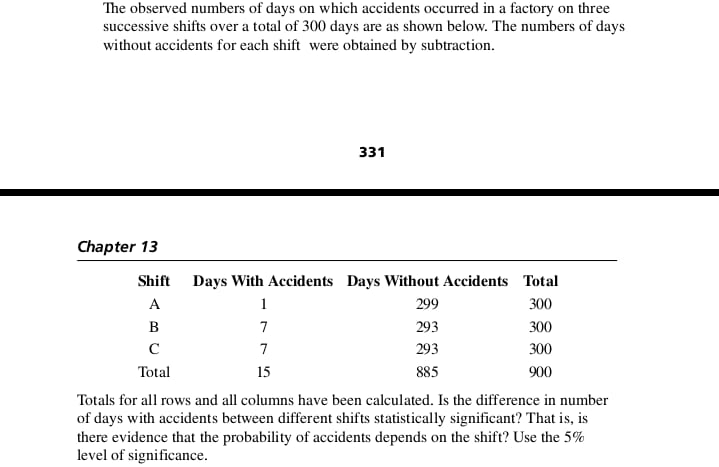
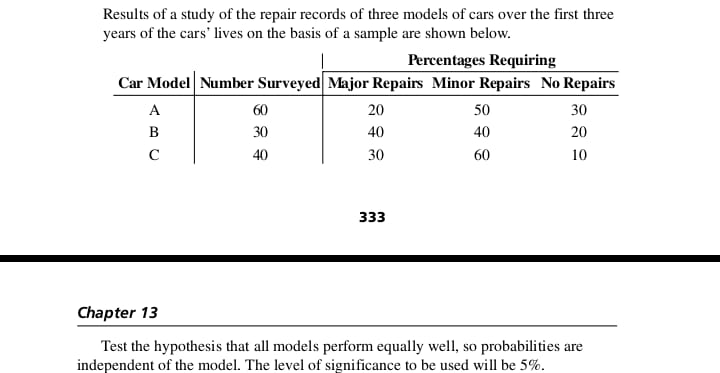
Daily evaporation rates were measured on 20 successive days. Which of two types of evaporation pan would be used on a particular day was decided by tossing a coin. The mean daily evaporation for the 10 days on which Pan A was used was 19.10 mm, and the mean evaporation on the 10 days on which Pan B was used was 17.24 mm. The variance estimated from the sample from Pan A is 7.72 mm, and the variance estimated from the sample from Pan B is 5.36 mm'. Assuming that these two estimates of variance are compatible, does the experimental evaporation pan, Pan A, give significantly higher evaporation rates than the standard pan, Pan B, at the 1% level of significance?Electrical components are manufactured continuously on a production line. Extensive data show that when all machines are correctly adjusted, a fraction 0.026 of the components are defective. However, some settings tend to vary as production contin- 264 Statistical Inferences for Variance and Proportion ues, so the fraction of defective components may increase. A sample of 420 compo- nents is taken at regular intervals, and the number of defective components in the sample is counted. If there are more than 16 defective components in the sample of 420, the production line will be stopped and adjustments will be made. (a) State the null hypothesis and alternative hypothesis in terms of p. (b) What is the observed level of significance if the number of defective components is just large enough to stop the production line? (c) Suppose the probability that a component will be defective has increased to 0.040. Then what is the probability of a Type II error? Answer: a) Hop = 0.026 H : p > 0.026 (one-tailed test) The binomial distribution applies with n = 420 and p = 0.026.A die was tossed 120 times with the observed frequencies shown below. Test whether the die shows evidence of bias at the 5% level of significance. Result 2 4 5 6 Observed frequency 12 25 28 14 15 26 Answer:The observed numbers of days on which accidents occurred in a factory on three successive shifts over a total of 300 days are as shown below. The numbers of days without accidents for each shift were obtained by subtraction. 331 Chapter 13 Shift Days With Accidents Days Without Accidents Total A 299 300 B 293 300 C 293 300 Total 15 885 900 Totals for all rows and all columns have been calculated. Is the difference in number of days with accidents between different shifts statistically significant? That is, is there evidence that the probability of accidents depends on the shift? Use the 5% level of significance.Results of a study of the repair records of three models of cars over the first three years of the cars' lives on the basis of a sample are shown below. Percentages Requiring Car Model Number Surveyed Major Repairs Minor Repairs No Repairs A 60 20 50 30 B 30 40 40 20 C 40 30 60 10 333 Chapter 13 Test the hypothesis that all models perform equally well, so probabilities are independent of the model. The level of significance to be used will be 5%