Dashboard | Colo x E Copy of 7. Rebuild x Physics A (FA22) x A Free Fall Online Li X Mod2_FreeFallOn| x Principles of Busi
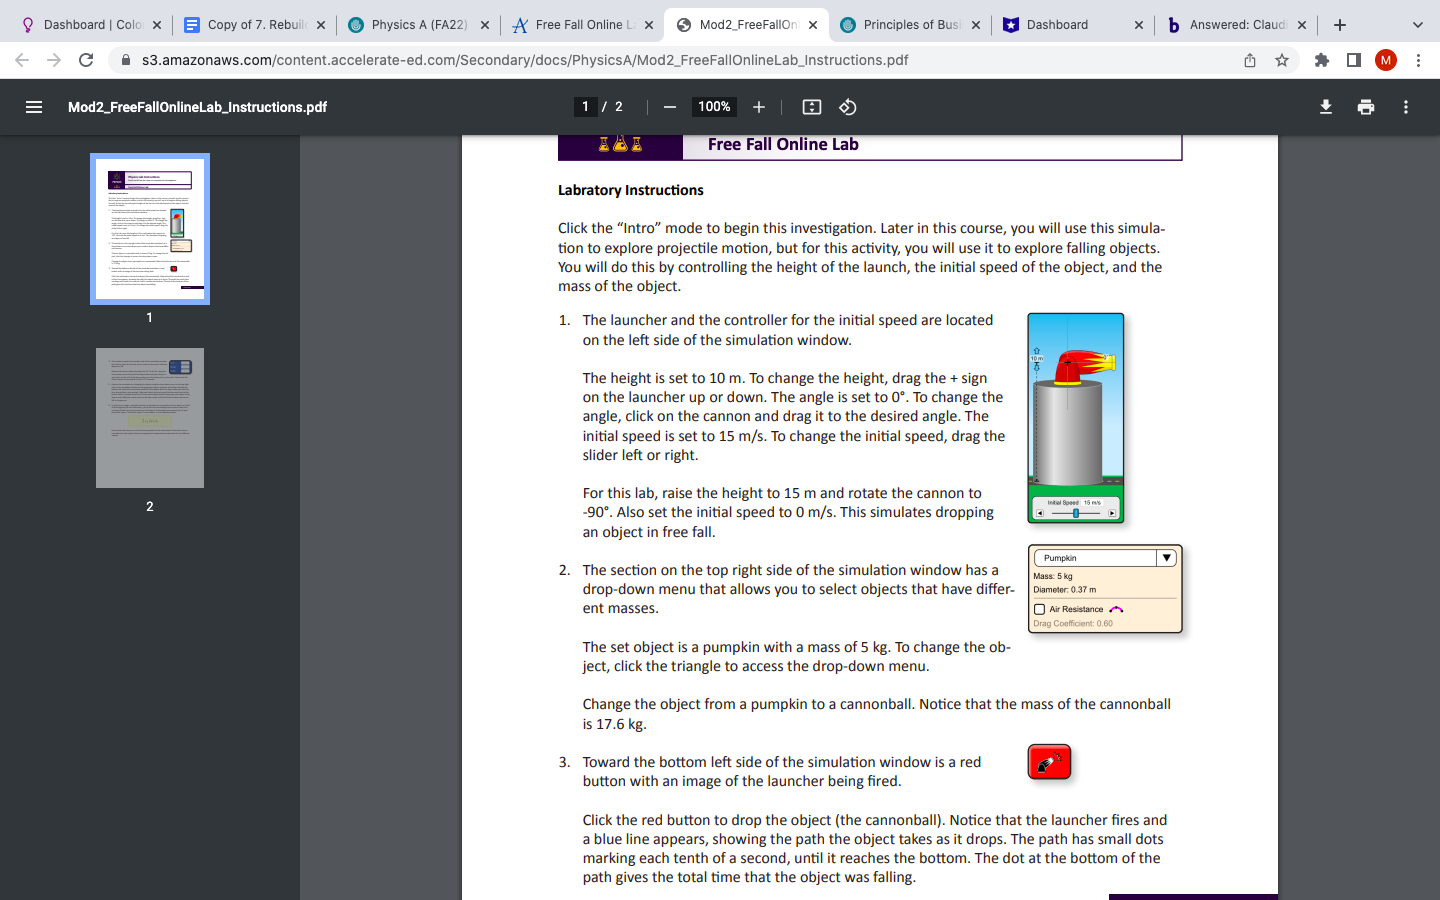
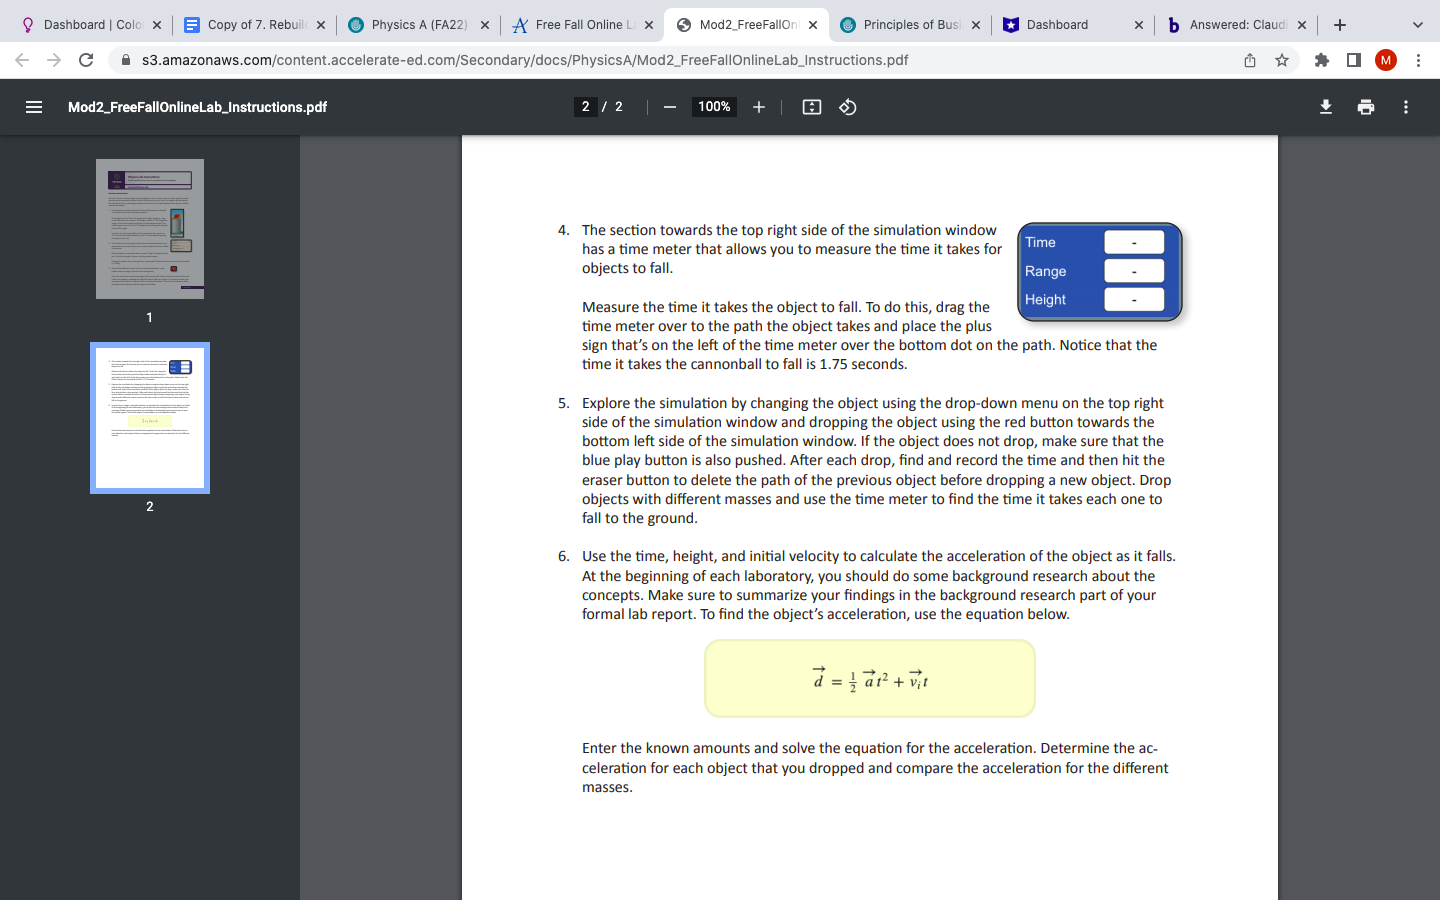
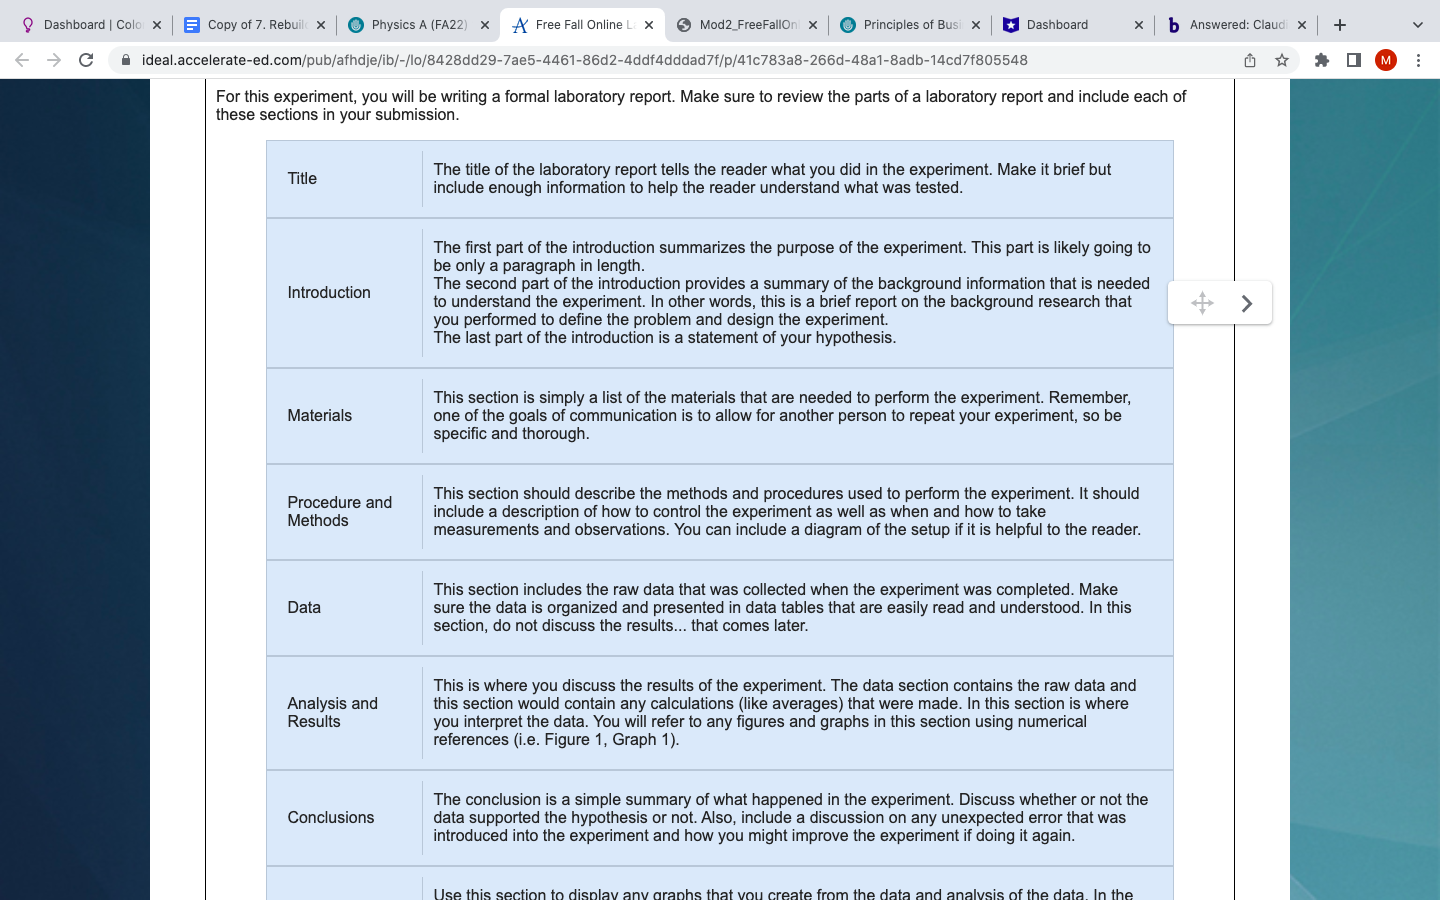
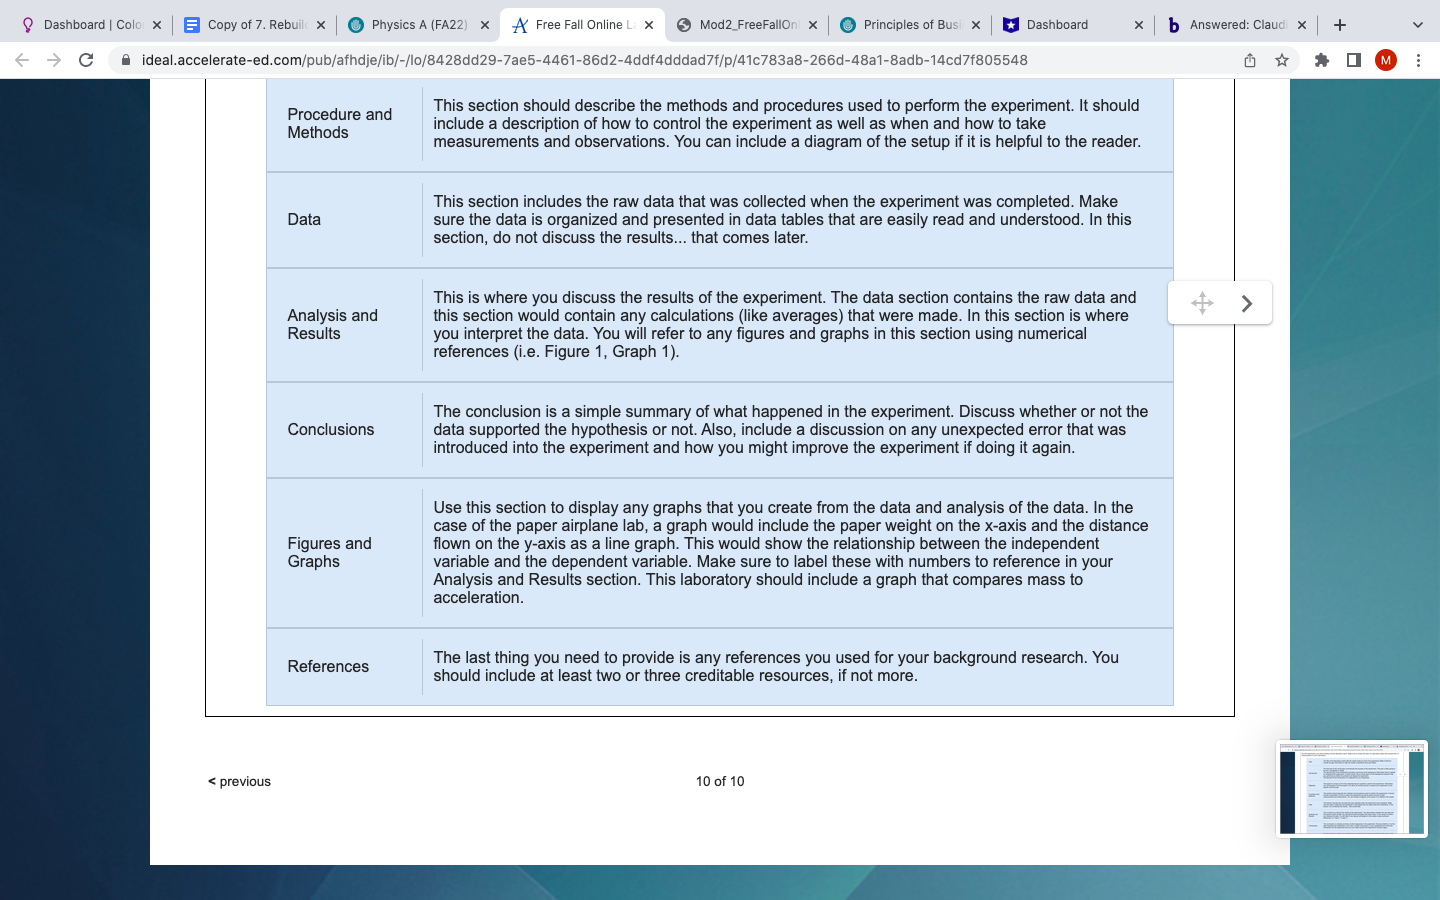
Dashboard | Colo x E Copy of 7. Rebuild x Physics A (FA22) x A Free Fall Online Li X Mod2_FreeFallOn| x Principles of Busi x Dashboard X b Answered: Claudi x + C A s3.amazonaws.com/content.accelerate-ed.com/Secondary/docs/PhysicsA/Mod2_FreeFallOnlineLab_Instructions.pdf * IM Mod2_FreeFallOnlineLab_Instructions.pdf 1 / 2 100% + HO Free Fall Online Lab Labratory Instructions Click the "Intro" mode to begin this investigation. Later in this course, you will use this simula- tion to explore projectile motion, but for this activity, you will use it to explore falling objects. You will do this by controlling the height of the launch, the initial speed of the object, and the mass of the object 1 1. The launcher and the controller for the initial speed are located on the left side of the simulation window. The height is set to 10 m. To change the height, drag the + sign on the launcher up or down. The angle is set to 0'. To change the angle, click on the cannon and drag it to the desired angle. The initial speed is set to 15 m/s. To change the initial speed, drag the slider left or right. For this lab, raise the height to 15 m and rotate the cannon to 2 -90. Also set the initial speed to 0 m/s. This simulates dropping an object in free fall. Pumpkin 2. The section on the top right side of the simulation window has a Mass: 5 kg drop-down menu that allows you to select objects that have differ- Diameter. 0.37 m ent masses. Air Resistance Drag Coefficient: 0,60 The set object is a pumpkin with a mass of 5 kg. To change the ob- ject, click the triangle to access the drop-down menu. Change the object from a pumpkin to a cannonball. Notice that the mass of the cannonball is 17.6 kg. 3. Toward the bottom left side of the simulation window is a red button with an image of the launcher being fired. Click the red button to drop the object (the cannonball). Notice that the launcher fires and a blue line appears, showing the path the object takes as it drops. The path has small dots marking each tenth of a second, until it reaches the bottom. The dot at the bottom of the path gives the total time that the object was falling.Dashboard | Colo x E Copy of 7. Rebuild x Physics A (FA22) x A Free Fall Online Li X Mod2_FreeFallOn| x Principles of Busi x Dashboard X b Answered: Claudi X + C A s3.amazonaws.com/content.accelerate-ed.com/Secondary/docs/PhysicsA/Mod2_FreeFallOnlineLab_Instructions.pdf * IM E Mod2_FreeFallOnlineLab_Instructions.pdf 2 / 2 | 100% + 4. The section towards the top right side of the simulation window has a time meter that allows you to measure the time it takes for Time objects to fall. Range Measure the time it takes the object to fall. To do this, drag the Height time meter over to the path the object takes and place the plus sign that's on the left of the time meter over the bottom dot on the path. Notice that the time it takes the cannonball to fall is 1.75 seconds. 5. Explore the simulation by changing the object using the drop-down menu on the top right side of the simulation window and dropping the object using the red button towards the bottom left side of the simulation window. If the object does not drop, make sure that the blue play button is also pushed. After each drop, find and record the time and then hit the eraser button to delete the path of the previous object before dropping a new object. Drop 2 objects with different masses and use the time meter to find the time it takes each one to fall to the ground. 6. Use the time, height, and initial velocity to calculate the acceleration of the object as it falls. At the beginning of each laboratory, you should do some background research about the concepts. Make sure to summarize your findings in the background research part of your formal lab report. To find the object's acceleration, use the equation below. d = bar + vit Enter the known amounts and solve the equation for the acceleration. Determine the ac- celeration for each object that you dropped and compare the acceleration for the different masses.Q DashboardiCoi: x | E Copyof7.RebL x t 9 PhysicsA[FA22 x 1% Free FailOnline x @ ModLFreeFallO- x | Q PrinciplesofBLs x | H Dashboard x | b Answereomlauc x l + v C i ideaiaccelerate-ed.comfpubjafhdjefibfflufllid[129-7835411161-86d24ddfddddad7ffpr'd1c78338-ZSSdda'iBadb-14cd7f805548 For this experiment, you will be writing a formal laboratory report. Make sure to review the parts of a laboratory report and include each of these sections in your submission. The title of the laboratory report tells the reader what you did in the experiment. Make it brief but Title include enough information to help the reader understand what was tested. The rst part of the introduction summarizes the purpose of the experiment. This part is likely going to be only a paragraph in length. Introduction The second part of the introduction provides a summary of the background information that is needed to understand the experiment. In other words, this is a brief report on the background research that you performed to define the problem and design the experiment. The last part of the introduction is a statement of your hypothesis. This section is simply a list of the materials that are needed to perform the experiment. Remember, Materials one ofthe goals of communication is to allow for another person to repeat your experiment, so be specic and thorough. This section should describe the methods and procedures used to perform the experiment. It should include a description of how to control the experiment as well as when and how to take measurements and observations. You can include a diagram of the setup if it is helpful to the reader. Procedure and Methods This section includes the raw data that was collected when the experiment was completed. Make Data sure the data is organized and presented in data tables that are easily read and understood. In this section, do not discuss the results... that comes later. This is where you discuss the results of the experiment. The data section contains the raw data and Analysis and this section would contain any calculations (like averages) that were made. In this section is where Results you interpret the data. You will referto any gures and graphs in this section using numerical references (Le. Figure 1. Graph 1). The conclusion is a simple summary of what happened in the experiment. Discuss whether or not the Conclusions data supported the hypothesis or not. Also. include a discussion on any unexpected error that was introduced into the experiment and how you might improve the experiment if doing it again. Use this section to display any graphs that you create from the data and analysis of the data. In the U onas Q DashboardiCol: x | E Copycf'LReoL C x i 9 PhysicsA[FA22 x i ideaiccelerate-ed.comfpubjafhdjefibfflcfB428dd29-7335-4461-86d24dd'iddddad7ffpi'd1c78338-ZSSdda'iBadb-14cd7f805548 Procedure and Methods Analysis and Results Conclusions Figures and Graphs References This section should describe the methods and procedures used to perform the experiments It should include a description of how to control the experiment as well as when and how to take measurements and observations. You can include a diagram of the setup if it is helpful to the reader. This section includes the raw data that was collected when the experiment was completed. Make sure the data is organized and presented in data tables that are easily read and understood. In this section, do not discuss the results... that comes later. This is where you discuss the results of the experiment. The data section contains the raw data and this section would contain any calculations (like averages) that were made. In this section is where you interpret the data. You will reterto any gures and graphs in this section using numerical references (Le. Figure 1. Graph 1). The conclusion is a simple summary of what happened in the experiment. Discuss whether or not the data supported the hypothesis or not. Also. include a discussion on any unexpected error that was introduced into the experiment and how you might improve the experiment if doing it again. Use this section to display any graphs that you create from the data and analysis of the data. In the case of the paper airplane lab. a graph would include the paper weight on the xaxis and the distance own on the y-axis as a line graph This would show the relationship between the independent variable and the dependent variable. Make sure to label these with numbers to reference in your Analysis and Results section. This laboratory should include a graph that compares mass to acceleration. The last thing you need to provide is any references you used for your background research. You should include at least two or three creditable resources. it not more.
Step by Step Solution
There are 3 Steps involved in it
Step: 1
Get Instant Access to Expert-Tailored Solutions
See step-by-step solutions with expert insights and AI powered tools for academic success
Step: 2
Step: 3
Ace Your Homework with AI
Get the answers you need in no time with our AI-driven, step-by-step assistance