Answered step by step
Verified Expert Solution
Question
1 Approved Answer
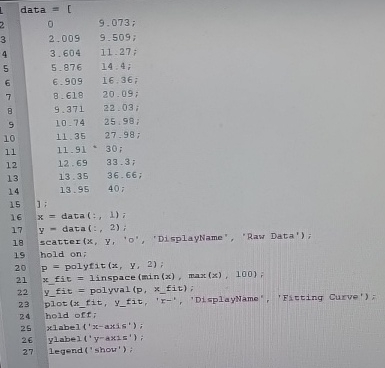
data 0 9 . 0 7 3 ; 2 . 0 0 9 , 9 . 5 0 9 ; 3 . 6 0 4
data
;
;
;
;
;
;
i
;
;
;
;
;
;
;
data;;
data;
scatter 'DisplayName', 'Raw Data';
hold on:
palyfit :
fit inspace max;
fit polyval pfit
I need to use the spline function, i just dont now how to implement the code. For the spline

Step by Step Solution
There are 3 Steps involved in it
Step: 1

Get Instant Access to Expert-Tailored Solutions
See step-by-step solutions with expert insights and AI powered tools for academic success
Step: 2

Step: 3

Ace Your Homework with AI
Get the answers you need in no time with our AI-driven, step-by-step assistance
Get Started


