

Question: data: -4.9 -8.18 -3.84 -7.79 -2.41 -7.11 -2.62 -6.15 -3.78 -5.62 -0.52 -3.30 -1.83 -2.05 -2.01 -2.83 0.28 -1.16 1.08 0.52 -0.94 0.21 0.59 1.73
data: -4.9 -8.18 -3.84 -7.79 -2.41 -7.11 -2.62 -6.15 -3.78 -5.62 -0.52 -3.30 -1.83 -2.05 -2.01 -2.83 0.28 -1.16 1.08 0.52 -0.94 0.21 0.59 1.73 0.69 3.96 3.04 4.26 1.01 5.75 3.60 6.67 4.53 7.70 5.13 7.31 4.43 9.05 4.12 10.95
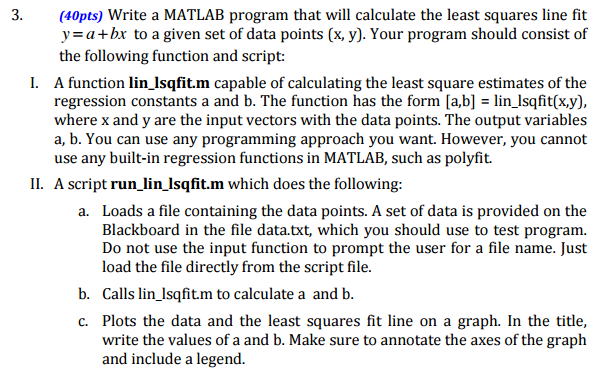
3. (40pts Write a MATLAB program that will calculate the least squares line fit y a+ lx to a given set of data points (x, y0. Your program should consist of the following function and script: A function lin lsqfit.m capable of calculating the least square estimates of the regression constants a and b. The function has the form [a,bl lin lsqfit(x,y), where x and y are the input vectors with the data points. The output variables a, b. You can use any programming approach you want. However, you cannot use any built-in regression functions in MATLAB, such as polyfit. II. A script run lin lsqfit.m which does the following a. Loads a file containing the data points. A set of data is provided on the Blackboard in the file which you should use to test program. Do not use the input function to prompt the user for a file name. Just load the file directly from the script file. b. Calls lin lsafit.m to calculate a and b. c. Plots the data and the least squares fit line on a graph. In the title, write the values of a and b. Make sure to annotate the axes of the graph and include a legend. 3. (40pts Write a MATLAB program that will calculate the least squares line fit y a+ lx to a given set of data points (x, y0. Your program should consist of the following function and script: A function lin lsqfit.m capable of calculating the least square estimates of the regression constants a and b. The function has the form [a,bl lin lsqfit(x,y), where x and y are the input vectors with the data points. The output variables a, b. You can use any programming approach you want. However, you cannot use any built-in regression functions in MATLAB, such as polyfit. II. A script run lin lsqfit.m which does the following a. Loads a file containing the data points. A set of data is provided on the Blackboard in the file which you should use to test program. Do not use the input function to prompt the user for a file name. Just load the file directly from the script file. b. Calls lin lsafit.m to calculate a and b. c. Plots the data and the least squares fit line on a graph. In the title, write the values of a and b. Make sure to annotate the axes of the graph and include a legend
Step by Step Solution
There are 3 Steps involved in it

Get step-by-step solutions from verified subject matter experts