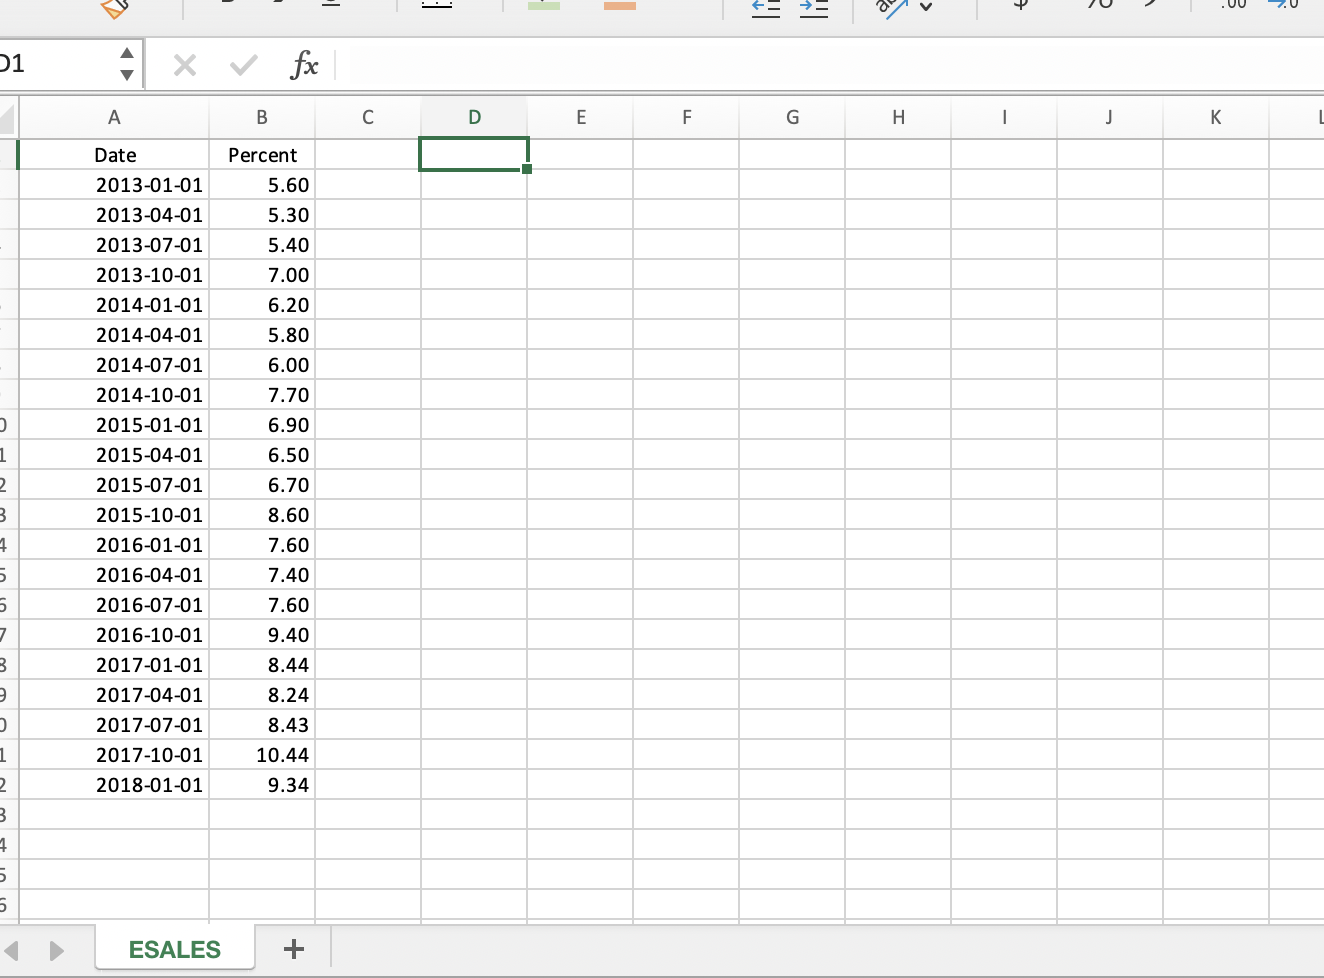
Data Analysis Questions for E-commerce Retail Sales: Downlod the Excel data of E-commerce Retail Sales and follow the steps below for time series forecasting. To be able to receive full credit, you must show your computations in the space provided for each question. 1. The series begin with the first quarter of 2013 and end with the first quarter of 2018. Show the time plot series that display quarterly e-commerce retail sales as a percent of total U.S. retail sales. Show your plot in the space provided below: (2p.) 2. Calculate the moving averages for each observation in the data based on periods 1, 2, 3, and 4. Show the time plot of quarterly e-commerce retail sales along with the moving- average forecasts based on a span of k-4. Make sure to include the labels of x and y axes and adjust the values on the plot to show the possible changes more clearly over the time. Show your plot in the space provided below: (3p.) 3. Use the figure from question #2 to interpret the seasonal regularity to the time series data (e-commerce retail sales). For instance, in which quarters do you observe percent sales are the lowest or the highest, or in which quarters do you observe a rise or a decline? Compare and contrast the component that you observe in the time series and the moving averages. (4p.) 4. Calculate the centered moving average (CMA) and show the time plot of quarterly e- commerce retail sales along with the centered moving-average forecasts based on a span of k=4. Make sure to include the labels of x and y axes and adjust the values on the plot to show the possible changes more clearly over the time. In the space provided below, show your plot, and compare and interpret the trend of two series. - - T: 0 c 00 V 2.0 + + D1 X fx A B D E F. G H 1 J K 1 2 3 1 Date 2013-01-01 2013-04-01 2013-07-01 2013-10-01 2014-01-01 2014-04-01 2014-07-01 2014-10-01 2015-01-01 2015-04-01 2015-07-01 2015-10-01 2016-01-01 2016-04-01 2016-07-01 2016-10-01 2017-01-01 2017-04-01 2017-07-01 2017-10-01 2018-01-01 Percent 5.60 5.30 5.40 7.00 6.20 5.80 6.00 7.70 6.90 6.50 6.70 8.60 7.60 7.40 7.60 9.40 8.44 8.24 8.43 10.44 9.34 5 7 3 o 1 2 3 7 5 5 ESALES + Data Analysis Questions for E-commerce Retail Sales: Downlod the Excel data of E-commerce Retail Sales and follow the steps below for time series forecasting. To be able to receive full credit, you must show your computations in the space provided for each question. 1. The series begin with the first quarter of 2013 and end with the first quarter of 2018. Show the time plot series that display quarterly e-commerce retail sales as a percent of total U.S. retail sales. Show your plot in the space provided below: (2p.) 2. Calculate the moving averages for each observation in the data based on periods 1, 2, 3, and 4. Show the time plot of quarterly e-commerce retail sales along with the moving- average forecasts based on a span of k-4. Make sure to include the labels of x and y axes and adjust the values on the plot to show the possible changes more clearly over the time. Show your plot in the space provided below: (3p.) 3. Use the figure from question #2 to interpret the seasonal regularity to the time series data (e-commerce retail sales). For instance, in which quarters do you observe percent sales are the lowest or the highest, or in which quarters do you observe a rise or a decline? Compare and contrast the component that you observe in the time series and the moving averages. (4p.) 4. Calculate the centered moving average (CMA) and show the time plot of quarterly e- commerce retail sales along with the centered moving-average forecasts based on a span of k=4. Make sure to include the labels of x and y axes and adjust the values on the plot to show the possible changes more clearly over the time. In the space provided below, show your plot, and compare and interpret the trend of two series. - - T: 0 c 00 V 2.0 + + D1 X fx A B D E F. G H 1 J K 1 2 3 1 Date 2013-01-01 2013-04-01 2013-07-01 2013-10-01 2014-01-01 2014-04-01 2014-07-01 2014-10-01 2015-01-01 2015-04-01 2015-07-01 2015-10-01 2016-01-01 2016-04-01 2016-07-01 2016-10-01 2017-01-01 2017-04-01 2017-07-01 2017-10-01 2018-01-01 Percent 5.60 5.30 5.40 7.00 6.20 5.80 6.00 7.70 6.90 6.50 6.70 8.60 7.60 7.40 7.60 9.40 8.44 8.24 8.43 10.44 9.34 5 7 3 o 1 2 3 7 5 5 ESALES +