

Question: Data Analytics Case Deferred Taxes and the Tax Cuts and Jobs Act of 2017 In the Data Analytics Cases in the previous chapter, we applied
Data Analytics Case Deferred Taxes and the Tax Cuts and Jobs Act of 2017
In the Data Analytics Cases in the previous chapter, we applied Tableau to examine a data set and create charts to examine two (hypothetical) publicly traded companies: GPS Corporation and Tru, Inc. as to their pattern of leasing facilities, their transition to the new lease accounting standard in 2019, and the effect of that transition on debt covenants. In this case, we examine the effect of the Tax Cuts and Jobs Act of 2017 on these companies operations and financial positions.
Resources:
Download the "GPS_Tru_Financials.xlsx" Excel file and save it to the computer on which you will be using Tableau.
For this case, you will create a calculations to produce the effective tax rate to allow you to compare and contrast the effect of the 2017 Tax Act on the two companies.
After you view the training videos, follow these steps to create the charts you'll use for this case:
- Open Tableau and connect to the Excel spreadsheet you downloaded.
- Starting on the Sheet 1 tab, drag Company and Year under Dimensions to the Columns shelf. Change Year to discrete by right-clicking and selecting Discrete.
- Drag Provision for income tax and Deferred income taxes under Measures into the Rows shelf.
- Click on the Show Me and select side-by-side bars. Add labels to the bars by clicking on "Label" under the "Marks card and clicking the box "Show mark labels." Format the labels to Times New Roman, bold, black and 10-point font. Edit the color of the years on the Color marks card if desired by dragging Year on to the color card.
- Change the title of the sheet to be Provision for Income Taxes and Deferred Tax Liability Trend 2012-2021 by right-clicking and selecting "Edit title." Format the title to Times New Roman, bold, black and 15-point font. Change the title of Sheet 1 to match the sheet title by right-clicking, selecting Rename and typing in the new title.
- On the Sheet 2 tab, follow the procedure above for the company and year.
- Drag Provision for income tax and Income from continuing operations under Measures into the Rows shelf. Change each to Discrete data and uncheck Show Header.
- Create a calculated field by clicking the Analysis tab at the top of the screen and selecting Create Calculated field. Name the calculation Effective Tax Rate. In the calculation box, drag the following from the Rows shelf: Provision for income taxes," type a division sign and open parenthesis, "Income from continuing operations, type an addition sign, Provision for income taxes, and type a closed parenthesis. Make sure the window says that the calculation is valid and click OK.
- Drag the newly created Effective Tax Rate to the Rows shelf. Click on the Show Me and select side-by-side bars. Add labels to the bars by clicking on "Label" under the "Marks card and clicking the box "Show mark labels." Format the labels to Times New Roman, bold, black and 10-point font. Edit the color on the Color marks card if desired.
- Change the title of the sheet to be Effect of the Tax Cuts and Jobs Act of 2017 by right-clicking and selecting "Edit title." Format the title to Times New Roman, bold, black and 15-point font. Change the title of Sheet 2 to match the sheet title by right-clicking, selecting Rename and typing in the new title.
- Format all other labels to be Times New Roman, bold, black and 12-point font.
- Once complete, save the file as DA16_Your initials.twbx.
Required:
For each of the two companies in the ten-year period, 2012-2021, use Tableau to calculate and display the trends for:
- (a) the provision for income taxes
- (b) the deferred tax liability, and
- (c) effective tax rate.
Based upon what you find, answer the following questions:
- Is Tru, Inc.s provision for income tax (a) higher, (b) lower, or (c) roughly the same over the period 2018-2021 than in previous years?
- Did Tru, Inc.s deferred tax liability appear to benefit from the Tax Act?
- What is the effective tax rate for GPS (provision for income tax divided by [net income plus provision for income tax]) in 2017? (Enter your answer as a whole percentage.)
- What is the effective tax rate for GPS (provision for income tax divided by [net income plus provision for income tax]) in 2018? (Enter your answer as a whole percentage.)
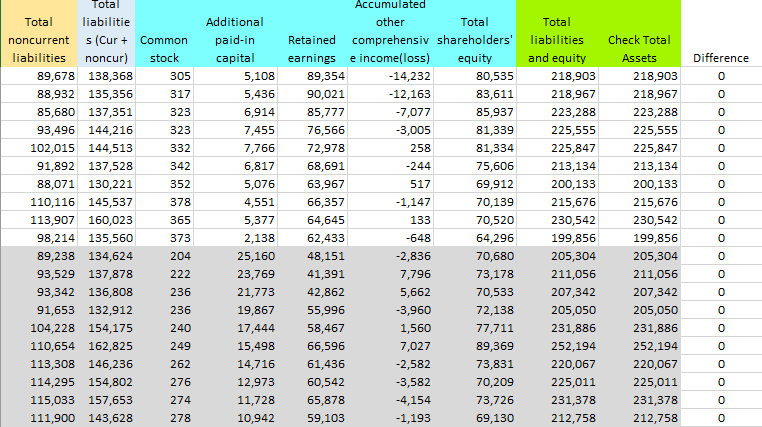
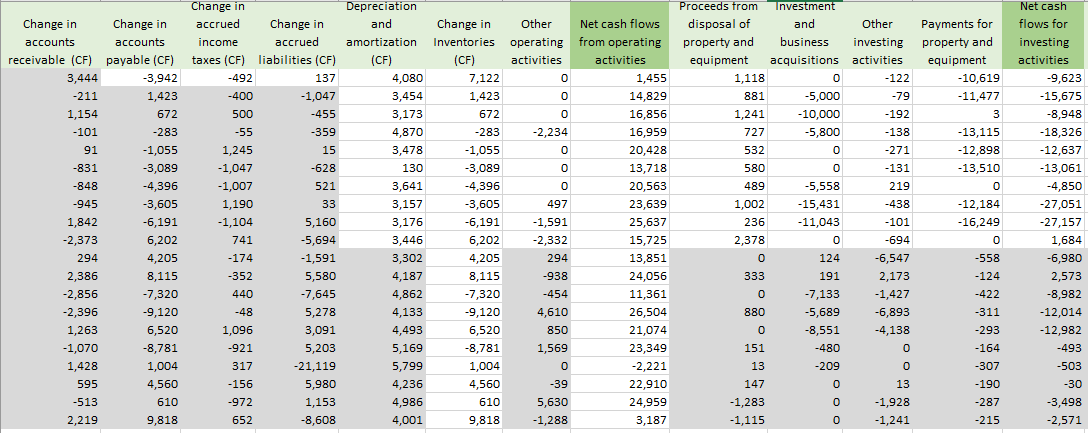
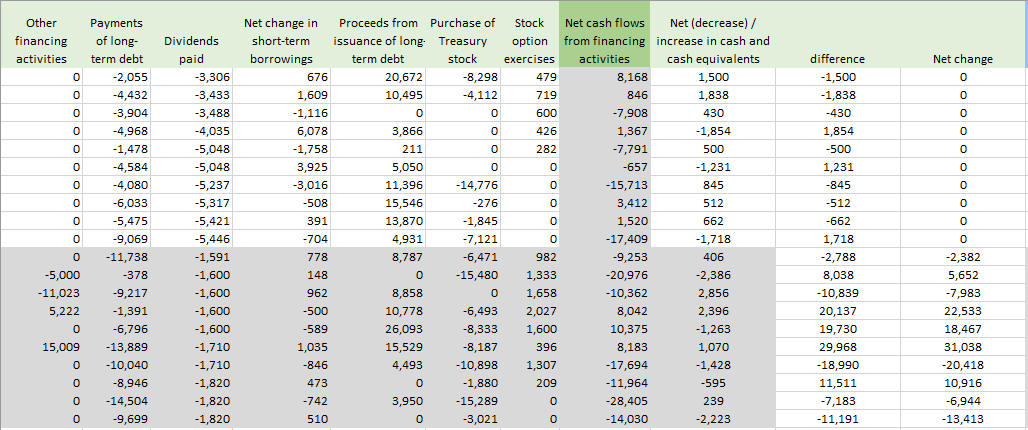
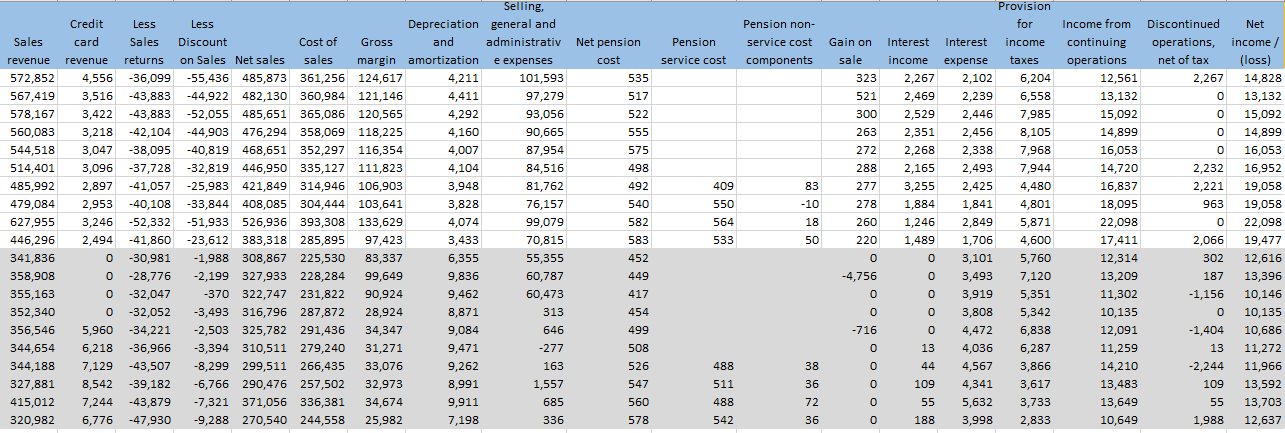
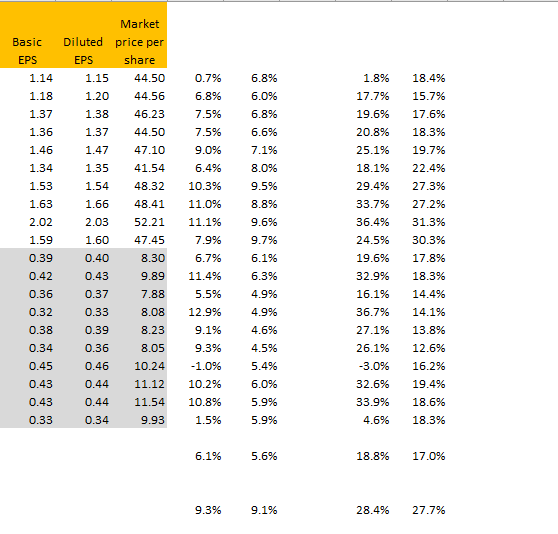
19,582 Land 26,026 25,659 25,722 25,098 24,045 22,475 21,545 19,988 26,931 18,748 27,138 27,222 27,231 27,302 27,582 27,209 26,347 25,747 31,267 22,949 Buildings and Fixtures and improvements equipment 117,567 23,334 115,907 23,005 116,194 23,061 113,373 22,502 108,615 21,557 101,526 20,150 97,323 19,316 100,290 17,920 121,653 24,145 84,688 16,808 117,116 24,458 113,701 23,764 115,719 23,760 135,179 23,107 122,624 23,831 141,383 22,849 102,810 21,951 95,400 21,080 84,228 34,105 87,447 24,829 Computer hardware Less and Construction-accumulated software in-progress depreciation Goodwill 10,770 1,795 -71,782 17,037 10,617 1,770 -66,787 16,695 10,644 1,774 -63,115 18,102 10,385 1,731 -57,725 19,510 9,950 1,658 -51,896 20,497 9,300 1,550 -45,399 20,651 8,915 1,486 -43,486 16,763 8,271 2,478 -36,649 25,026 11,144 3,457 -58,733 21,028 7,758 1,993 -24,288 13,524 11,782 889 -55,391 3,480 11,631 1,400 -56,613 3,760 11,347 1,884 -58,813 5,391 10,644 364 -69,516 4,921 11,409 5,227 -60,040 4,987 10,969 4,280 -55,031 4,587 11,258 2,520 -51,356 4,440 11,444 2,331 -46,600 3,684 12,406 3,083 -65,861 3,883 9,504 1,544 -45,057 2,210 Property Right of use asset - Right of use asset - under capital Pension Plan operating net, finance, net lease Assets 0 0 6,468 20,078 0 0 6,345 19,386 0 0 2,375 0 0 2,543 20,804 0 0 2,752 22,742 0 0 2,721 19,728 0 0 2,780 19,470 4,015 1,503 0 22,514 4,513 1,671 0 25,456 3,417 1,777 0 26,011 0 0 5,498 16,944 0 0 5,330 16,829 0 0 2,256 15,648 0 0 2,340 17,036 0 0 2,504 18,708 0 0 2,612 19,896 0 0 2,502 20,823 4,030 2,812 0 21,642 4,022 3,011 0 22,617 3,875 3,034 0 23,621 Investments in equity securities 9,921 6,131 5,671 6,149 5,987 5,456 4,129 3,942 4,786 3,423 102 1,231 309 2,236 2,219 334 2,270 1,556 1,322 578 Total noncurrent assets 161,214 158,728 160,010 164,370 165,907 158, 159 148,240 169,299 186,051 153,860 152,015 148,256 144,733 153,614 159,051 179,087 143,565 143,127 134,083 134,533 Current liabilities of discontinued Current portion operations capital lease 0 720 0 698 Current portion Current portion of lease of lease liability - liability - finance lease operating lease 0 0 o 0 o 0 0 0 O O 0 89 313 335 0 363 361 0 Short-term borrowings 1,099 2,708 1,592 7,670 6,805 4,047 1,031 523 914 210 0 47 378 0 Accrued liabilitie Accrued income s taxes 20,654 921 19,607 521 19,152 1,021 18,793 966 18,808 2,211 18,180 1,164 18,701 157 18,734 1,347 23,894 243 18,200 984 16,609 810 22,189 458 14,544 898 19,822 850 22,913 1,946 28,116 1,024 6,997 1,341 12,977 1,185 14,130 214 5,522 866 0 0 684 650 Total assets 218,903 218,967 223,288 225,555 225,847 213,134 200,133 215,676 230,542 199,856 205,304 211,056 207,342 205,050 231,886 252,194 220,067 225,011 231,378 212,758 92 99 Accounts payable 23,102 20,330 25,690 19,492 9,765 20,147 18,005 10,329 15,197 14,061 24,651 17,929 22,319 15,835 19,813 19,158 20,019 20,724 22,172 20,521 0 0 342 445 506 0 Current portion of long-term debt 2,194 2,560 3,903 3,375 4,547 1,737 3,831 3,370 4,674 2,678 1,931 2,253 3,435 2,970 4,001 1,529 2,977 2,966 4,113 2,357 102 606 0 396 0 0 988 0 384 0 0 0 65 172 184 200 0 102 199 208 1,136 2,098 1,598 1,009 2,044 1,198 1,671 929 1,439 188 81 0 301 392 o 602 0 0 583 87 90 0 400 533 O O O O Debt to Equity 1.71812 1.61887 1.59827 1.77302 1.77679 1.81901 1.86264 2.07498 2.2692 2.10838 1.90469 1.88415 1.93963 1.84247 1.98395 1.82194 1.98067 2.20487 2.13837 2.07765 Tota Projected current Benefit liabilitie Obligatio Long-term S n debt 48,690 22,309 52,032 46,424 21,540 54,255 51,671 21,757 52,512 50,720 23,115 58,085 42,499 23,939 66,516 45,636 20,767 59,696 42,150 20,495 58,195 35,421 22,514 74,563 46,116 24,243 76,696 37,347 24,309 61,958 45,385 18,827 56,906 44,349 18,699 63,269 43,466 17,387 65,914 41,259 18,929 61,904 49,947 20,787 73,270 52,171 21,166 79,429 32,928 21,919 83,134 40,507 22,781 80,406 42,620 23,317 80,438 31,728 24,103 77,192 Capital lease Lease liability - Lease liability - liability operating lease finance lease 6,003 0 0 5,816 0 0 2,606 0 0 2,788 0 3,023 0 3,009 0 3,150 0 0 6,215 3,108 0 5,313 3,110 0 4,017 3,305 5,283 0 5,118 0 2,293 0 2,453 0 2,660 0 2,648 0 2,772 4,034 2,767 3,971 2,929 3,807 2,993 Deferred income taxes 9,334 7,321 8,805 9,508 8,536 8,421 6,231 3,716 4,545 4,624 8,223 6,443 7,748 8,367 7,511 7,410 5,483 4,308 4,379 3,806 Total Total liabilitie noncurrent s (Cur + liabilities noncur) 89,678 138,368 88,932 135,356 85,680 137,351 93,496 144,216 102,015 144,513 91,892 137,528 88,071 130,221 110,116 145,537 113,907 160,023 98,214 135,560 89,238 134,624 93,529 137,878 93,342 136,808 91,653 132,912 104,228 154,175 110,654 162,825 113,308 146,236 114,295 154,802 115,033 157,653 111,900 143,628 Oo ($ in 000s) Company GPS GPS GPS GPS GPS GPS GPS GPS GPS GPS Cash and cash Year equivalents 2012 6,867 2013 8,705 2014 9,135 2015 7,281 2016 7,781 2017 6,550 2018 7,395 2019 7,907 2020 8,569 2021 6,851 2012 7,257 2013 4,871 2014 7,727 2015 10,122 2016 8,859 2017 9,929 2018 8,501 2019 7,906 2020 8,145 2021 5,922 Receivables, net 5,835 5,624 6,778 6,677 6,768 5,937 5,089 4,144 5,986 3,613 3,908 6,294 3,438 1,042 2,306 1,235 2,663 3,258 2,746 4,964 Assets of Prepaid discontinued expenses and Inventory operations other 43,046 0 1,941 44,469 o 1,441 45,141 o 2,224 44,858 460 1,909 43,803 0 1,588 40,714 0 1,774 36,318 131 2,960 32,713 140 1,473 26,523 -211 3,625 32,724 -150 2,958 36,929 307 4,889 45,044 1,431 5,160 37,724 5,924 7,796 28,604 3,524 8,143 35,124 18,280 8,267 26,343 27,555 8,044 27,347 30,204 7,787 31,907 29,573 9,240 32,517 46,730 7,158 42,335 18,540 6,464 Total current assets 57,689 60,239 63,278 61,185 59,940 54,975 51,893 46,377 44,491 45,996 53,289 62,800 62,609 51,436 72,836 73,107 76,502 81,884 97,295 78,225 Tru Tru Tru Tru Tru Tru Tru Tru Tru Tru Difference 0 0 0 0 0 0 0 0 Total Total liabilitie noncurrent s (Cur + Common liabilities noncur) stock 89,678 138,368 305 88,932 135,356 317 85,680 137,351 323 93,496 144,216 323 102,015 144,513 332 91,892 137,528 342 88,071 130,221 352 110,116 145,537 378 113,907 160,023 365 98,214 135,560 373 89,238 134,624 204 93,529 137,878 222 93,342 136,808 236 91,653 132,912 236 104,228 154,175 240 110,654 162,825 249 113,308 146,236 262 114,295 154,802 276 115,033 157,653 274 111,900 143,628 278 Additional paid-in capital 5,108 5,436 6,914 7,455 7,766 6,817 5,076 4,551 5,377 2,138 25,160 23,769 21,773 19,867 17,444 15,498 14,716 12,973 11,728 10,942 Accumulated other Total Total Retained comprehensiv shareholders' liabilities earnings e incomelloss) equity and equity 89,354 -14,232 80,535 218,903 90,021 -12,163 83,611 218,967 85,777 -7,077 85,937 223,288 76,566 -3,005 81,339 225,555 72,978 258 81,334 225,847 68,691 -244 75,606 213,134 63,967 517 69,912 200,133 66,357 -1,147 70,139 215,676 64,645 133 70,520 230,542 62,433 -648 64,296 199,856 48,151 -2,836 70,680 205,304 41,391 7,796 73,178 211,056 42,862 5,662 70,533 207,342 55,996 -3,960 72,138 205,050 58,467 1,560 77,711 231,886 66,596 7,027 89,369 252,194 61,436 -2,582 73,831 220,067 60,542 -3,582 70,209 225,011 65,878 -4,154 73,726 231,378 59,103 -1,193 69,130 212,758 Check Total Assets 218,903 218,967 223,288 225,555 225,847 213,134 200,133 215,676 230,542 199,856 205,304 211,056 207,342 205,050 231,886 252,194 220,067 225,011 231,378 212,758 O O 0 0 0 0 0 O O O O O Payments for property and equipment -10,619 -1,047 -11,477 Change in Change in accounts accounts receivable (CF) payable (CF) 3,444 -3,942 -211 1,423 1,154 672 -101 -283 91 -1,055 -831 -3,089 -848 -4,396 -945 -3,605 1,842 -6,191 -2,373 6,202 294 4,205 2,386 8,115 -2,856 -7,320 -2,396 -9,120 1,263 6,520 -1,070 -8,781 1,428 1,004 595 4,560 -513 610 2,219 9,818 Change in accrued Change in income accrued taxes (CF) liabilities (CF) -492 137 -400 500 -455 -55 -359 1,245 15 -1,047 -628 -1,007 521 1,190 33 -1,104 5,160 741 -5,694 -174 -1,591 -352 5,580 440 -7,645 -48 1,096 3,091 -921 5,203 317 -21,119 -156 5,980 -972 1,153 652 -8,608 Depreciation and amortization (CF) 4,080 3,454 3,173 4,870 3,478 130 3,641 3,157 3,176 3,446 3,302 4,187 4,862 4,133 4,493 5,169 5,799 4,236 4,986 4,001 Change in Inventories (CF) 7,122 1,423 672 -283 -1,055 -3,089 -4,396 -3,605 -6,191 6,202 4,205 8,115 -7,320 -9,120 6,520 -8,781 1,004 4,560 610 9,818 Other Net cash flows operating from operating activities activities 0 1,455 0 14,829 0 16,856 -2,234 16,959 0 20,428 0 13,718 0 20,563 497 23,639 -1,591 25,637 -2,332 15,725 294 13,851 -938 24,056 -454 11,361 4,610 26,504 850 21,074 1,569 23,349 0 -2,221 -39 22,910 5,630 24,959 -1,288 3,187 Proceeds from investment disposal of and Other property and business investing equipment acquisitions activities 1,118 0 -122 881 -5,000 -79 1,241 -10,000 -192 727 -5,800 -138 532 0 -271 580 0 -131 489 -5,558 219 1,002 -15,431 -438 236 -11,043 -101 2,378 0 -694 0 124 -6,547 333 191 2,173 0 -7,133 -1,427 880 -5,689 -6,893 0 -8,551 -4,138 151 -480 0 13 -209 0 147 0 13 -1,283 0 -1,928 -1,115 0 -1,241 3 -13,115 -12,898 -13,510 0 -12,184 -16,249 0 -558 -124 -422 -311 -293 -164 -307 -190 -287 -215 Net cash flows for investing activities -9,623 -15,675 -8,948 -18,326 -12,637 -13,061 -4,850 -27,051 -27,157 1,684 -6,980 2,573 -8,982 -12,014 -12,982 -493 -503 -30 -3,498 -2,571 5,278 Other financing activities 0 0 Net change 0 difference -1,500 -1,838 -430 1,854 0 0 0 0 0 0 0 0 -500 1,231 -845 -512 0 0 o 0 Payments of long- term debt -2,055 -4,432 -3,904 -4,968 -1,478 -4,584 -4,080 -6,033 -5,475 -9,069 -11,738 -378 -9,217 -1,391 -6,796 -13,889 -10,040 -8,946 -14,504 -9,699 0 0 0 0 0 -5,000 -11,023 5,222 0 15,009 Net change in Proceeds from Purchase of Stock Net cash flows Net (decrease) / short-term issuance of long Treasury option from financing increase in cash and borrowings term debt stock exercises activities cash equivalents 676 20,672 -8,298 479 8,168 1,500 1,609 10,495 -4,112 719 846 1,838 -1,116 0 0 600 -7,908 430 6,078 3,866 0 426 1,367 -1,854 -1,758 211 0 282 -7,791 500 3,925 5,050 0 0 -657 -1.231 -3,016 11,396 -14,776 0 -15,713 845 -508 15,546 -276 0 3,412 512 391 13,870 -1,845 0 1,520 662 -704 4,931 -7,121 0 -17,409 -1,718 778 8,787 -6,471 982 -9,253 406 148 0 -15,480 1,333 -20,976 -2,386 962 8,858 0 1,658 -10,362 2,856 -500 10,778 -6,493 2,027 8,042 2,396 -589 26,093 -8,333 1,600 10,375 -1,263 1,035 15,529 -8,187 396 8,183 1,070 -846 4,493 -10,898 1,307 -17,694 -1,428 473 0 -1,880 209 -11,964 -595 -742 3,950 -15,289 -28,405 239 510 0 -3,021 -14,030 -2,223 Dividends paid -3,306 -3,433 -3,488 -4,035 -5,048 -5,048 -5,237 -5,317 -5,421 -5,446 -1,591 -1,600 -1,600 -1,600 -1,600 -1,710 -1,710 -1,820 -1,820 -1,820 0 -662 1,718 -2,788 8,038 -10,839 20,137 19,730 29,968 -18,990 11,511 -2,382 5,652 -7,983 22,533 18,467 31,038 -20,418 10,916 -6,944 -13,413 0 0 0 -7,183 0 -11,191 Interest Pension non- service cost components Net pension cost 535 Interest Pension service cost Gain on sale 323 521 300 263 Discontinued operations, net of tax 2,267 0 517 0 0 0 83 Selling Credit Less Less Depreciation general and card Sales Discount Cost of Gross and administrativ revenue returns on Sales Net sales sales margin amortization e expenses 4,556 -36,099 -55,436 485,873 361,256 124,617 4,211 101,593 3,516 -43,883 -44,922 482,130 360,984 121,146 4,411 97,279 3,422 -43,883 -52,055 485,651 365,086 120,565 4,292 93,056 3,218 -42,104 -44,903 476,294 358,069 118,225 4,160 90,665 3,047 -38,095 -40,819 468,651 352,297 116,354 4,007 87,954 3,096 -37,728 -32,819 446,950 335,127 111,823 4,104 84,516 2,897 -41,057 -25,983 421,849 314,946 106,903 3,948 81,762 2,953 -40,108 -33,844 408,085 304,444 103,641 3,828 76,157 3,246 -52,332 -51,933 526,936 393,308 133,629 4,074 99,079 2,494 -41,860 -23,612 383,318 285,895 97,423 3,433 70,815 0 -30,981 -1,988 308,867 225,530 83,337 6,355 55,355 0 -28,776 -2,199 327,933 228,284 99,649 9,836 60,787 0 -32,047 -370 322,747 231,822 90,924 9,462 60,473 0 -32,052 -3,493 316,796 287,872 28,924 8,871 313 5,960 -34,221 -2,503 325,782 291,436 34,347 9,084 646 6,218 -36,966 -3,394 310,511 279,240 31,271 9,471 -277 7,129 -43,507 -8,299 299,511 266,435 33,076 9,262 163 8,542 -39,182 -6,766 290,476 257,502 32,973 8,991 1,557 7,244 -43,879 -7,321 371,056 336,381 34,674 9,911 685 6,776 -47,930 -9,288 270,540 244,558 25,982 7,198 336 income 2,267 2,469 2,529 2,351 2.268 2,165 3,255 1,884 1,246 1,489 Sales revenue 572,852 567,419 578,167 560,083 544,518 514,401 485,992 479,084 627,955 446,296 341,836 358,908 355,163 352,340 356,546 344,654 344,188 327,881 415,012 320,982 272 288 277 278 260 409 550 564 533 -10 18 Provision for income taxes 6,204 6,558 7,985 8,105 7,968 7,944 4,480 4,801 5,871 4,600 5,760 7,120 5,351 5,342 6,838 6,287 3,866 3,617 3,733 2,833 522 555 575 498 492 540 582 583 452 449 417 454 499 508 526 547 560 578 Income from continuing operations 12,561 13,132 15,092 14,899 16,053 14,720 16,837 18,095 22,098 17,411 12,314 13,209 11,302 10,135 12,091 11,259 14,210 13,483 13,649 10,649 expense 2,102 2,239 2,446 2,456 2,338 2,493 2,425 1,841 2,849 1,706 3,101 3,493 3,919 3,808 4,472 4,036 4,567 4,341 5,632 3,998 50 Net income / (loss) 14,828 13,132 15,092 14,899 16,053 16,952 19,058 19,058 22,098 19,477 12,616 13,396 10,146 10,135 10,686 11,272 11,966 13,592 13,703 12,637 220 0 -4,756 0 0 0 2,232 2,221 963 0 2,066 302 187 -1.156 0 -1,404 13 -2,244 109 55 1,988 0 0 0 -716 0 0 0 13 44 488 511 488 38 36 72 36 0 0 109 55 542 0 188 Basic EPS 1.14 1.18 1.37 Market Diluted price per EPS share 1.15 44.50 1.20 44.56 1.38 46.23 1.37 44.50 1.47 47.10 1.35 41.54 1.54 48.32 1.66 48.41 2.03 52.21 6.8% 6.0% 6.8% 6.6% 1.36 1.46 0.7% 6.8% 7.5% 7.5% 9.0% 6.4% 10.3% 11.0% 11.1% 7.1% 8.0% 1.34 1.53 1.63 2.02 47.45 8.30 9.89 1.59 0.39 0.42 0.36 0.32 0.38 0.34 0.45 1.60 0.40 0.43 0.37 0.33 0.39 0.36 0.46 0.44 0.44 7.9% 6.7% 11.4% 5.5% 12.9% 9.1% 9.3% 1.8% 17.7% 19.6% 20.8% 25.1% 18.1% 29.4% 33.7% 36.4% 24.5% 19.6% 32.9% 16.1% 36.7% 27.1% 26.1% -3.0% 32.6% 33.9% 9.5% 8.8% 9.6% 9.7% 6.1% 6.3% 4.9% 4.9% 4.6% 4.5% 5.4% 6.0% 5.9% 5.9% 7.88 8.08 8.23 8.05 18.4% 15.7% 17.6% 18.3% 19.7% 22.4% 27.3% 27.2% 31.3% 30.3% 17.8% 18.39 14.4% 14.1% 13.8% 12.6% 16.2% 19.4% 18.6% 18.3% 10.24 0.43 0.43 11.12 11.54 9.93 -1.0% 10.2% 10.8% 1.5% 0.33 0.34 4.6% 6.1% 5.6% 18.8% 17.0% 9.3% 9.1% 28.4% 27.7% 19,582 Land 26,026 25,659 25,722 25,098 24,045 22,475 21,545 19,988 26,931 18,748 27,138 27,222 27,231 27,302 27,582 27,209 26,347 25,747 31,267 22,949 Buildings and Fixtures and improvements equipment 117,567 23,334 115,907 23,005 116,194 23,061 113,373 22,502 108,615 21,557 101,526 20,150 97,323 19,316 100,290 17,920 121,653 24,145 84,688 16,808 117,116 24,458 113,701 23,764 115,719 23,760 135,179 23,107 122,624 23,831 141,383 22,849 102,810 21,951 95,400 21,080 84,228 34,105 87,447 24,829 Computer hardware Less and Construction-accumulated software in-progress depreciation Goodwill 10,770 1,795 -71,782 17,037 10,617 1,770 -66,787 16,695 10,644 1,774 -63,115 18,102 10,385 1,731 -57,725 19,510 9,950 1,658 -51,896 20,497 9,300 1,550 -45,399 20,651 8,915 1,486 -43,486 16,763 8,271 2,478 -36,649 25,026 11,144 3,457 -58,733 21,028 7,758 1,993 -24,288 13,524 11,782 889 -55,391 3,480 11,631 1,400 -56,613 3,760 11,347 1,884 -58,813 5,391 10,644 364 -69,516 4,921 11,409 5,227 -60,040 4,987 10,969 4,280 -55,031 4,587 11,258 2,520 -51,356 4,440 11,444 2,331 -46,600 3,684 12,406 3,083 -65,861 3,883 9,504 1,544 -45,057 2,210 Property Right of use asset - Right of use asset - under capital Pension Plan operating net, finance, net lease Assets 0 0 6,468 20,078 0 0 6,345 19,386 0 0 2,375 0 0 2,543 20,804 0 0 2,752 22,742 0 0 2,721 19,728 0 0 2,780 19,470 4,015 1,503 0 22,514 4,513 1,671 0 25,456 3,417 1,777 0 26,011 0 0 5,498 16,944 0 0 5,330 16,829 0 0 2,256 15,648 0 0 2,340 17,036 0 0 2,504 18,708 0 0 2,612 19,896 0 0 2,502 20,823 4,030 2,812 0 21,642 4,022 3,011 0 22,617 3,875 3,034 0 23,621 Investments in equity securities 9,921 6,131 5,671 6,149 5,987 5,456 4,129 3,942 4,786 3,423 102 1,231 309 2,236 2,219 334 2,270 1,556 1,322 578 Total noncurrent assets 161,214 158,728 160,010 164,370 165,907 158, 159 148,240 169,299 186,051 153,860 152,015 148,256 144,733 153,614 159,051 179,087 143,565 143,127 134,083 134,533 Current liabilities of discontinued Current portion operations capital lease 0 720 0 698 Current portion Current portion of lease of lease liability - liability - finance lease operating lease 0 0 o 0 o 0 0 0 O O 0 89 313 335 0 363 361 0 Short-term borrowings 1,099 2,708 1,592 7,670 6,805 4,047 1,031 523 914 210 0 47 378 0 Accrued liabilitie Accrued income s taxes 20,654 921 19,607 521 19,152 1,021 18,793 966 18,808 2,211 18,180 1,164 18,701 157 18,734 1,347 23,894 243 18,200 984 16,609 810 22,189 458 14,544 898 19,822 850 22,913 1,946 28,116 1,024 6,997 1,341 12,977 1,185 14,130 214 5,522 866 0 0 684 650 Total assets 218,903 218,967 223,288 225,555 225,847 213,134 200,133 215,676 230,542 199,856 205,304 211,056 207,342 205,050 231,886 252,194 220,067 225,011 231,378 212,758 92 99 Accounts payable 23,102 20,330 25,690 19,492 9,765 20,147 18,005 10,329 15,197 14,061 24,651 17,929 22,319 15,835 19,813 19,158 20,019 20,724 22,172 20,521 0 0 342 445 506 0 Current portion of long-term debt 2,194 2,560 3,903 3,375 4,547 1,737 3,831 3,370 4,674 2,678 1,931 2,253 3,435 2,970 4,001 1,529 2,977 2,966 4,113 2,357 102 606 0 396 0 0 988 0 384 0 0 0 65 172 184 200 0 102 199 208 1,136 2,098 1,598 1,009 2,044 1,198 1,671 929 1,439 188 81 0 301 392 o 602 0 0 583 87 90 0 400 533 O O O O Debt to Equity 1.71812 1.61887 1.59827 1.77302 1.77679 1.81901 1.86264 2.07498 2.2692 2.10838 1.90469 1.88415 1.93963 1.84247 1.98395 1.82194 1.98067 2.20487 2.13837 2.07765 Tota Projected current Benefit liabilitie Obligatio Long-term S n debt 48,690 22,309 52,032 46,424 21,540 54,255 51,671 21,757 52,512 50,720 23,115 58,085 42,499 23,939 66,516 45,636 20,767 59,696 42,150 20,495 58,195 35,421 22,514 74,563 46,116 24,243 76,696 37,347 24,309 61,958 45,385 18,827 56,906 44,349 18,699 63,269 43,466 17,387 65,914 41,259 18,929 61,904 49,947 20,787 73,270 52,171 21,166 79,429 32,928 21,919 83,134 40,507 22,781 80,406 42,620 23,317 80,438 31,728 24,103 77,192 Capital lease Lease liability - Lease liability - liability operating lease finance lease 6,003 0 0 5,816 0 0 2,606 0 0 2,788 0 3,023 0 3,009 0 3,150 0 0 6,215 3,108 0 5,313 3,110 0 4,017 3,305 5,283 0 5,118 0 2,293 0 2,453 0 2,660 0 2,648 0 2,772 4,034 2,767 3,971 2,929 3,807 2,993 Deferred income taxes 9,334 7,321 8,805 9,508 8,536 8,421 6,231 3,716 4,545 4,624 8,223 6,443 7,748 8,367 7,511 7,410 5,483 4,308 4,379 3,806 Total Total liabilitie noncurrent s (Cur + liabilities noncur) 89,678 138,368 88,932 135,356 85,680 137,351 93,496 144,216 102,015 144,513 91,892 137,528 88,071 130,221 110,116 145,537 113,907 160,023 98,214 135,560 89,238 134,624 93,529 137,878 93,342 136,808 91,653 132,912 104,228 154,175 110,654 162,825 113,308 146,236 114,295 154,802 115,033 157,653 111,900 143,628 Oo ($ in 000s) Company GPS GPS GPS GPS GPS GPS GPS GPS GPS GPS Cash and cash Year equivalents 2012 6,867 2013 8,705 2014 9,135 2015 7,281 2016 7,781 2017 6,550 2018 7,395 2019 7,907 2020 8,569 2021 6,851 2012 7,257 2013 4,871 2014 7,727 2015 10,122 2016 8,859 2017 9,929 2018 8,501 2019 7,906 2020 8,145 2021 5,922 Receivables, net 5,835 5,624 6,778 6,677 6,768 5,937 5,089 4,144 5,986 3,613 3,908 6,294 3,438 1,042 2,306 1,235 2,663 3,258 2,746 4,964 Assets of Prepaid discontinued expenses and Inventory operations other 43,046 0 1,941 44,469 o 1,441 45,141 o 2,224 44,858 460 1,909 43,803 0 1,588 40,714 0 1,774 36,318 131 2,960 32,713 140 1,473 26,523 -211 3,625 32,724 -150 2,958 36,929 307 4,889 45,044 1,431 5,160 37,724 5,924 7,796 28,604 3,524 8,143 35,124 18,280 8,267 26,343 27,555 8,044 27,347 30,204 7,787 31,907 29,573 9,240 32,517 46,730 7,158 42,335 18,540 6,464 Total current assets 57,689 60,239 63,278 61,185 59,940 54,975 51,893 46,377 44,491 45,996 53,289 62,800 62,609 51,436 72,836 73,107 76,502 81,884 97,295 78,225 Tru Tru Tru Tru Tru Tru Tru Tru Tru Tru Difference 0 0 0 0 0 0 0 0 Total Total liabilitie noncurrent s (Cur + Common liabilities noncur) stock 89,678 138,368 305 88,932 135,356 317 85,680 137,351 323 93,496 144,216 323 102,015 144,513 332 91,892 137,528 342 88,071 130,221 352 110,116 145,537 378 113,907 160,023 365 98,214 135,560 373 89,238 134,624 204 93,529 137,878 222 93,342 136,808 236 91,653 132,912 236 104,228 154,175 240 110,654 162,825 249 113,308 146,236 262 114,295 154,802 276 115,033 157,653 274 111,900 143,628 278 Additional paid-in capital 5,108 5,436 6,914 7,455 7,766 6,817 5,076 4,551 5,377 2,138 25,160 23,769 21,773 19,867 17,444 15,498 14,716 12,973 11,728 10,942 Accumulated other Total Total Retained comprehensiv shareholders' liabilities earnings e incomelloss) equity and equity 89,354 -14,232 80,535 218,903 90,021 -12,163 83,611 218,967 85,777 -7,077 85,937 223,288 76,566 -3,005 81,339 225,555 72,978 258 81,334 225,847 68,691 -244 75,606 213,134 63,967 517 69,912 200,133 66,357 -1,147 70,139 215,676 64,645 133 70,520 230,542 62,433 -648 64,296 199,856 48,151 -2,836 70,680 205,304 41,391 7,796 73,178 211,056 42,862 5,662 70,533 207,342 55,996 -3,960 72,138 205,050 58,467 1,560 77,711 231,886 66,596 7,027 89,369 252,194 61,436 -2,582 73,831 220,067 60,542 -3,582 70,209 225,011 65,878 -4,154 73,726 231,378 59,103 -1,193 69,130 212,758 Check Total Assets 218,903 218,967 223,288 225,555 225,847 213,134 200,133 215,676 230,542 199,856 205,304 211,056 207,342 205,050 231,886 252,194 220,067 225,011 231,378 212,758 O O 0 0 0 0 0 O O O O O Payments for property and equipment -10,619 -1,047 -11,477 Change in Change in accounts accounts receivable (CF) payable (CF) 3,444 -3,942 -211 1,423 1,154 672 -101 -283 91 -1,055 -831 -3,089 -848 -4,396 -945 -3,605 1,842 -6,191 -2,373 6,202 294 4,205 2,386 8,115 -2,856 -7,320 -2,396 -9,120 1,263 6,520 -1,070 -8,781 1,428 1,004 595 4,560 -513 610 2,219 9,818 Change in accrued Change in income accrued taxes (CF) liabilities (CF) -492 137 -400 500 -455 -55 -359 1,245 15 -1,047 -628 -1,007 521 1,190 33 -1,104 5,160 741 -5,694 -174 -1,591 -352 5,580 440 -7,645 -48 1,096 3,091 -921 5,203 317 -21,119 -156 5,980 -972 1,153 652 -8,608 Depreciation and amortization (CF) 4,080 3,454 3,173 4,870 3,478 130 3,641 3,157 3,176 3,446 3,302 4,187 4,862 4,133 4,493 5,169 5,799 4,236 4,986 4,001 Change in Inventories (CF) 7,122 1,423 672 -283 -1,055 -3,089 -4,396 -3,605 -6,191 6,202 4,205 8,115 -7,320 -9,120 6,520 -8,781 1,004 4,560 610 9,818 Other Net cash flows operating from operating activities activities 0 1,455 0 14,829 0 16,856 -2,234 16,959 0 20,428 0 13,718 0 20,563 497 23,639 -1,591 25,637 -2,332 15,725 294 13,851 -938 24,056 -454 11,361 4,610 26,504 850 21,074 1,569 23,349 0 -2,221 -39 22,910 5,630 24,959 -1,288 3,187 Proceeds from investment disposal of and Other property and business investing equipment acquisitions activities 1,118 0 -122 881 -5,000 -79 1,241 -10,000 -192 727 -5,800 -138 532 0 -271 580 0 -131 489 -5,558 219 1,002 -15,431 -438 236 -11,043 -101 2,378 0 -694 0 124 -6,547 333 191 2,173 0 -7,133 -1,427 880 -5,689 -6,893 0 -8,551 -4,138 151 -480 0 13 -209 0 147 0 13 -1,283 0 -1,928 -1,115 0 -1,241 3 -13,115 -12,898 -13,510 0 -12,184 -16,249 0 -558 -124 -422 -311 -293 -164 -307 -190 -287 -215 Net cash flows for investing activities -9,623 -15,675 -8,948 -18,326 -12,637 -13,061 -4,850 -27,051 -27,157 1,684 -6,980 2,573 -8,982 -12,014 -12,982 -493 -503 -30 -3,498 -2,571 5,278 Other financing activities 0 0 Net change 0 difference -1,500 -1,838 -430 1,854 0 0 0 0 0 0 0 0 -500 1,231 -845 -512 0 0 o 0 Payments of long- term debt -2,055 -4,432 -3,904 -4,968 -1,478 -4,584 -4,080 -6,033 -5,475 -9,069 -11,738 -378 -9,217 -1,391 -6,796 -13,889 -10,040 -8,946 -14,504 -9,699 0 0 0 0 0 -5,000 -11,023 5,222 0 15,009 Net change in Proceeds from Purchase of Stock Net cash flows Net (decrease) / short-term issuance of long Treasury option from financing increase in cash and borrowings term debt stock exercises activities cash equivalents 676 20,672 -8,298 479 8,168 1,500 1,609 10,495 -4,112 719 846 1,838 -1,116 0 0 600 -7,908 430 6,078 3,866 0 426 1,367 -1,854 -1,758 211 0 282 -7,791 500 3,925 5,050 0 0 -657 -1.231 -3,016 11,396 -14,776 0 -15,713 845 -508 15,546 -276 0 3,412 512 391 13,870 -1,845 0 1,520 662 -704 4,931 -7,121 0 -17,409 -1,718 778 8,787 -6,471 982 -9,253 406 148 0 -15,480 1,333 -20,976 -2,386 962 8,858 0 1,658 -10,362 2,856 -500 10,778 -6,493 2,027 8,042 2,396 -589 26,093 -8,333 1,600 10,375 -1,263 1,035 15,529 -8,187 396 8,183 1,070 -846 4,493 -10,898 1,307 -17,694 -1,428 473 0 -1,880 209 -11,964 -595 -742 3,950 -15,289 -28,405 239 510 0 -3,021 -14,030 -2,223 Dividends paid -3,306 -3,433 -3,488 -4,035 -5,048 -5,048 -5,237 -5,317 -5,421 -5,446 -1,591 -1,600 -1,600 -1,600 -1,600 -1,710 -1,710 -1,820 -1,820 -1,820 0 -662 1,718 -2,788 8,038 -10,839 20,137 19,730 29,968 -18,990 11,511 -2,382 5,652 -7,983 22,533 18,467 31,038 -20,418 10,916 -6,944 -13,413 0 0 0 -7,183 0 -11,191 Interest Pension non- service cost components Net pension cost 535 Interest Pension service cost Gain on sale 323 521 300 263 Discontinued operations, net of tax 2,267 0 517 0 0 0 83 Selling Credit Less Less Depreciation general and card Sales Discount Cost of Gross and administrativ revenue returns on Sales Net sales sales margin amortization e expenses 4,556 -36,099 -55,436 485,873 361,256 124,617 4,211 101,593 3,516 -43,883 -44,922 482,130 360,984 121,146 4,411 97,279 3,422 -43,883 -52,055 485,651 365,086 120,565 4,292 93,056 3,218 -42,104 -44,903 476,294 358,069 118,225 4,160 90,665 3,047 -38,095 -40,819 468,651 352,297 116,354 4,007 87,954 3,096 -37,728 -32,819 446,950 335,127 111,823 4,104 84,516 2,897 -41,057 -25,983 421,849 314,946 106,903 3,948 81,762 2,953 -40,108 -33,844 408,085 304,444 103,641 3,828 76,157 3,246 -52,332 -51,933 526,936 393,308 133,629 4,074 99,079 2,494 -41,860 -23,612 383,318 285,895 97,423 3,433 70,815 0 -30,981 -1,988 308,867 225,530 83,337 6,355 55,355 0 -28,776 -2,199 327,933 228,284 99,649 9,836 60,787 0 -32,047 -370 322,747 231,822 90,924 9,462 60,473 0 -32,052 -3,493 316,796 287,872 28,924 8,871 313 5,960 -34,221 -2,503 325,782 291,436 34,347 9,084 646 6,218 -36,966 -3,394 310,511 279,240 31,271 9,471 -277 7,129 -43,507 -8,299 299,511 266,435 33,076 9,262 163 8,542 -39,182 -6,766 290,476 257,502 32,973 8,991 1,557 7,244 -43,879 -7,321 371,056 336,381 34,674 9,911 685 6,776 -47,930 -9,288 270,540 244,558 25,982 7,198 336 income 2,267 2,469 2,529 2,351 2.268 2,165 3,255 1,884 1,246 1,489 Sales revenue 572,852 567,419 578,167 560,083 544,518 514,401 485,992 479,084 627,955 446,296 341,836 358,908 355,163 352,340 356,546 344,654 344,188 327,881 415,012 320,982 272 288 277 278 260 409 550 564 533 -10 18 Provision for income taxes 6,204 6,558 7,985 8,105 7,968 7,944 4,480 4,801 5,871 4,600 5,760 7,120 5,351 5,342 6,838 6,287 3,866 3,617 3,733 2,833 522 555 575 498 492 540 582 583 452 449 417 454 499 508 526 547 560 578 Income from continuing operations 12,561 13,132 15,092 14,899 16,053 14,720 16,837 18,095 22,098 17,411 12,314 13,209 11,302 10,135 12,091 11,259 14,210 13,483 13,649 10,649 expense 2,102 2,239 2,446 2,456 2,338 2,493 2,425 1,841 2,849 1,706 3,101 3,493 3,919 3,808 4,472 4,036 4,567 4,341 5,632 3,998 50 Net income / (loss) 14,828 13,132 15,092 14,899 16,053 16,952 19,058 19,058 22,098 19,477 12,616 13,396 10,146 10,135 10,686 11,272 11,966 13,592 13,703 12,637 220 0 -4,756 0 0 0 2,232 2,221 963 0 2,066 302 187 -1.156 0 -1,404 13 -2,244 109 55 1,988 0 0 0 -716 0 0 0 13 44 488 511 488 38 36 72 36 0 0 109 55 542 0 188 Basic EPS 1.14 1.18 1.37 Market Diluted price per EPS share 1.15 44.50 1.20 44.56 1.38 46.23 1.37 44.50 1.47 47.10 1.35 41.54 1.54 48.32 1.66 48.41 2.03 52.21 6.8% 6.0% 6.8% 6.6% 1.36 1.46 0.7% 6.8% 7.5% 7.5% 9.0% 6.4% 10.3% 11.0% 11.1% 7.1% 8.0% 1.34 1.53 1.63 2.02 47.45 8.30 9.89 1.59 0.39 0.42 0.36 0.32 0.38 0.34 0.45 1.60 0.40 0.43 0.37 0.33 0.39 0.36 0.46 0.44 0.44 7.9% 6.7% 11.4% 5.5% 12.9% 9.1% 9.3% 1.8% 17.7% 19.6% 20.8% 25.1% 18.1% 29.4% 33.7% 36.4% 24.5% 19.6% 32.9% 16.1% 36.7% 27.1% 26.1% -3.0% 32.6% 33.9% 9.5% 8.8% 9.6% 9.7% 6.1% 6.3% 4.9% 4.9% 4.6% 4.5% 5.4% 6.0% 5.9% 5.9% 7.88 8.08 8.23 8.05 18.4% 15.7% 17.6% 18.3% 19.7% 22.4% 27.3% 27.2% 31.3% 30.3% 17.8% 18.39 14.4% 14.1% 13.8% 12.6% 16.2% 19.4% 18.6% 18.3% 10.24 0.43 0.43 11.12 11.54 9.93 -1.0% 10.2% 10.8% 1.5% 0.33 0.34 4.6% 6.1% 5.6% 18.8% 17.0% 9.3% 9.1% 28.4% 27.7%
Step by Step Solution
There are 3 Steps involved in it

Get step-by-step solutions from verified subject matter experts