

Question: data and resources are there thanks! data for quesiton 1 Games1vs2 (this is entered through iNZight to get the graph) Data for question 3 Housesales1
 data for quesiton 1 "Games1vs2" (this is entered through iNZight to get the graph)
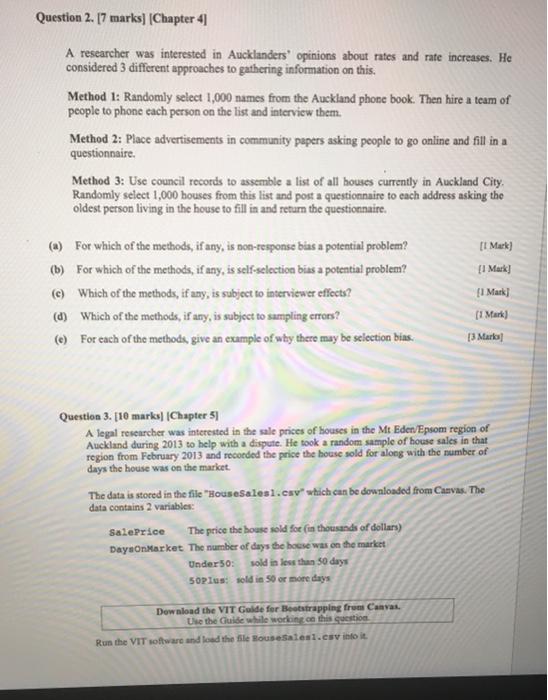
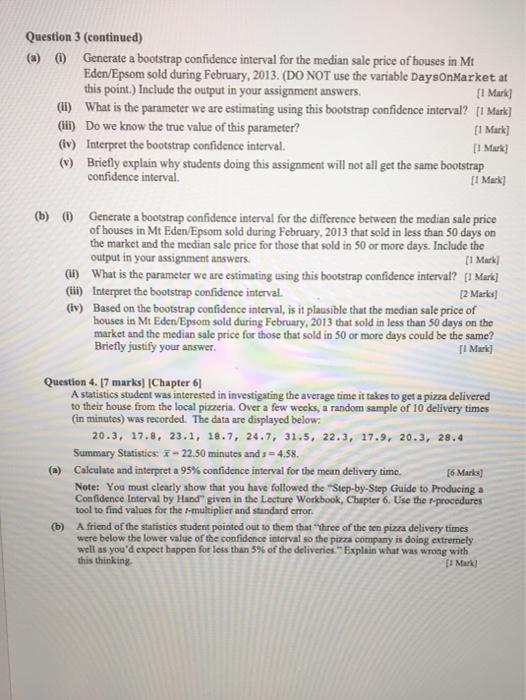
 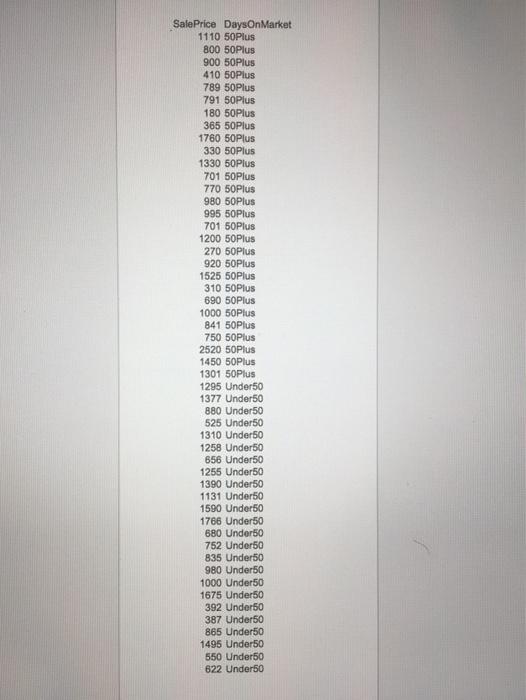 Data for question 3 "Housesales1" (this is entered through iNZight to get the graph)
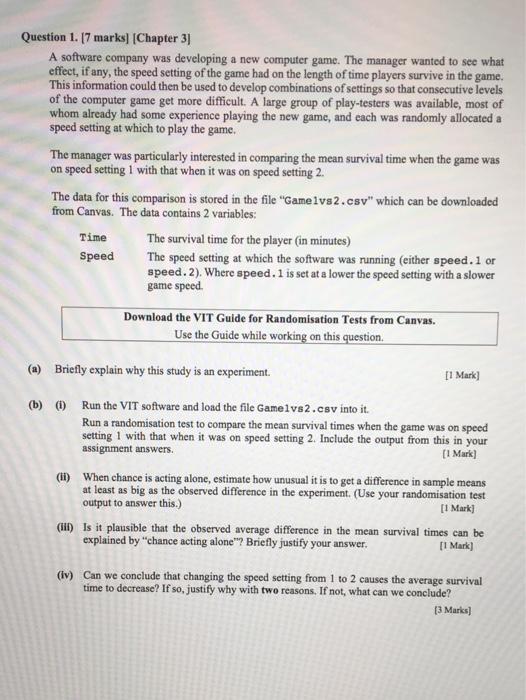
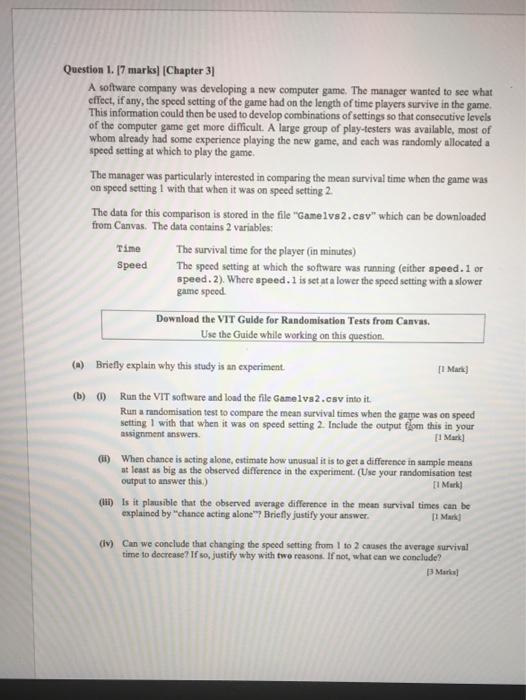
 Data for "question 1" and you get the graph through "iNZight"
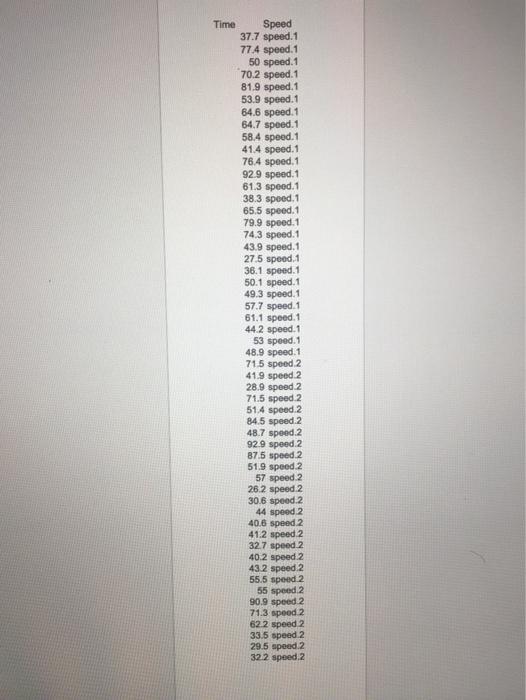
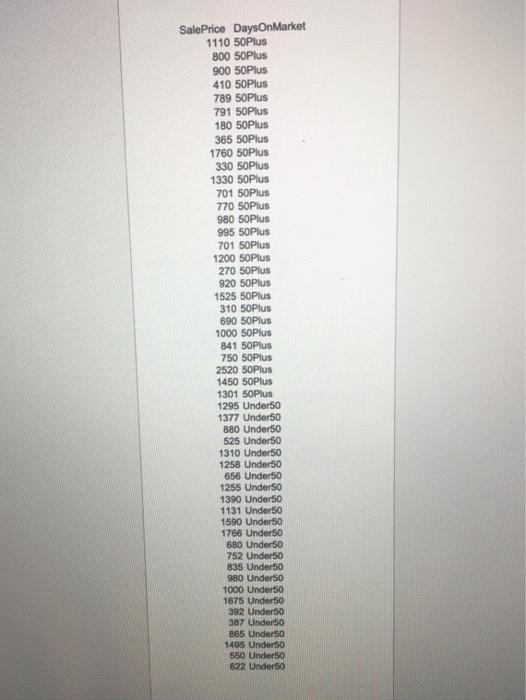
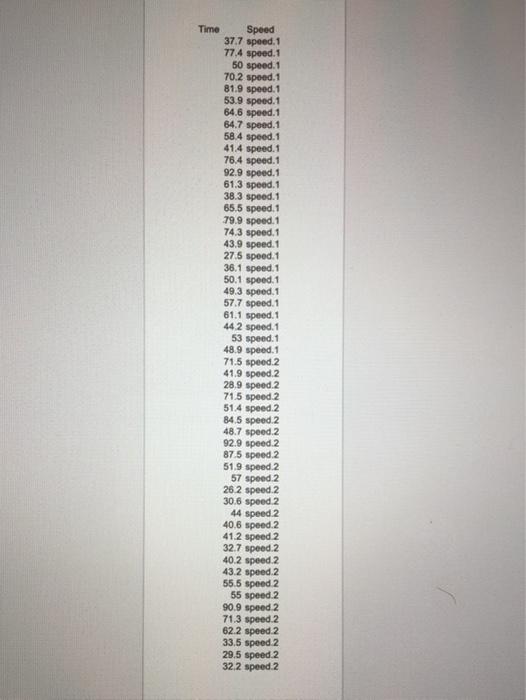
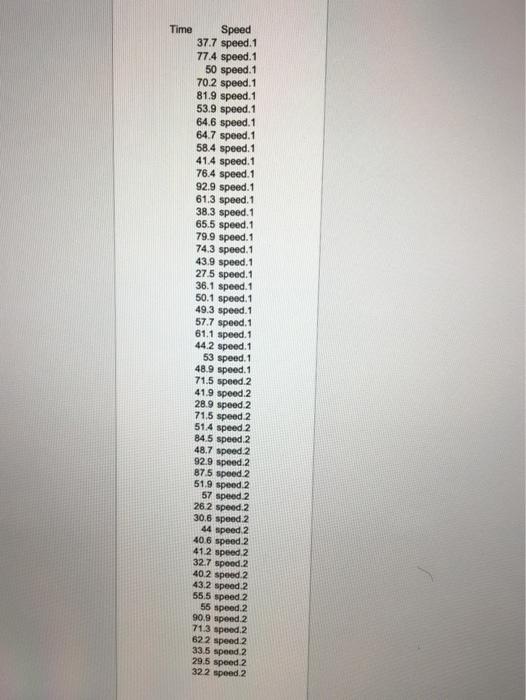
1.17 marial Chapter 41 Asher ward Auckland place where and we coded different approaches to bring to this Method It Randomly select 1.000m from the Auckland shock. There at of people that eachers in the last view the Metod Place advertise in commonly papers in people to read Question 1.17 mars Chapter 31 A www.copy was developing new compunere Theme wasted to me what act, if y, the edge of the law the ghoftim players in the game This information the bed to developinions of sings so that come level of the compune difficult. A large proup of players wat will most of whom hrady had experience playing the new game, and each wadonly allowed spoling at which to play the The manager was particularly interested in comparing the mean turvival time when the new spending with that when it was on pedig The us for this companies tored in the file canela.wtich an be downloaded to Carra, Thedas contas 2 variables Tine The survival time for the player in mine) Speed The speed wetting at which the software warming the speed. 1 wpeed. 2) Wheer speed. 1 lower the speeding with lower Method will to some list of all house in Auckland Clay Randomly welet 1.000 homes from this list and post questions to each with oldes en living in the ho illis and the gloria 11 For which of the method, if any, mehi penal problem? Par which of the method, if any, well in a potential problem! Which of the method if y, tu saject to interviewerfect (4) Which of the method, any, a je to sampling ? *) For each of the methods, we in example of why they may be sluction bu Download EVIT Guide for Radiation Tests from Canvas Uw the Ouide while working on this question IM 13 Bly explain why this study is an experimen a) un the VIT ownload the analys2.win it Rusdominent to compare the mean survival times when the newed I with that when it was speed setting 2. Include the output from this to your Mail 0 When chance is acting alone, imate how is to get a difference is ample www big as the herved difference in the experiment your resume test output to werth) W la plenible that the served avenge difference in the survival mes ante explained by chance ating Alone Bridly ify your wwwer Mest Question. 10 markal Chapter All her in the sale prion of houses in the Midnom region of Auckland during 2015 to help with a disput. He took a tudom sample of home sales in that from February 2013 and recorded the price the old for some with the number of days the one the market The dann is stored in the file hostel.cur which can be downloaded from Cana. The data con 2 variables Salice There howed for those of dollar) Day Market The umber of day that the market Under 50 sold in less than 30 days sols sold in 0 m dys O Casa comelade but changing the speeding them to comes the wengi e del fily why with two on. not, what can we concede? Download the VIT Guide for trapping from Us Guide while won question In the IT and the file housesalent.cn para WEATS Our Chap 2014 www wwwwwwww Q (N) Cabello mediale price of his M Wimm dry, 2011. DO NOT the Day lak IMA When the per we are imbra twowth www of this hthebop concert 11 (W Brittly auptain ety alai ce IM Dely han of the la w The wwwww www.They wwwy wed The Yal 300. Ya 15540 T10 while 2000 2010 495 wy ow D 34 29 an en beendence de thee of in Medgy, 2013 had the media prohinclude est in your IMA 00 What is the power Interpreted aralia to home home in prehry, 2013 was so are nilae natural parties that all 30 ye male he is a 10 13 2-3 49 GINE 41 Bingo Ding the rest per week in 2009 and report on the per week in 2000 - a team 2016 e proprio dalle white 2010, played the power 4. Imara Chapter Aiden asinsvegg the wind e house to the local para Orafowanie of 10 recordedThe displayed 20.), 17.1. 23.1. 18.1, 2.1, 3.1, 3), 13., 20., 21.6 Summary Studies - 158 Csendintcoinerval for the wym Note: You must clearly that you have followed the suplyse des Producing Cofidence level by Handel in the Workbook Chapter tool to find the whiplerinden Athenefeld at the theme of in delivery a helease the marina pa pa ly wallpaper for loss than of the deliver Explain what we wong wit Contattare for the free here te proporti You show the lowed by Water formada Time Speed 37.7 speed. 1 77.4 speed. 1 50 speed. 1 70.2 speed. 1 81.9 speed. 1 53.9 speed. 1 84.6 speed. 1 64.7 speed. 1 58.4 speed. 1 41.4 speed. 1 76.4 speed. 1 92.9 speed. 1 61.3 spood. 1 38.3 spoed. 1 65.5 speed. 1 79.9 speed. 1 74.3 speed. 1 43.9 speed. 1 27.5 speed, 1 36.1 speed. 1 50.1 speed. 1 49.3 speed. 1 57.7 speed. 1 61.1 speed. 1 44.2 speed. 1 53 speed. 1 48.9 speed. 1 71.5 speed 2 41.9 speed 2 28.9 speed 2 71.5 speed 2 51.4 speed.2 84.5 speed.2 48.7 speed.2 92.9 speed.2 87.5 speed 2 519 speed 2 57 speed 2 26.2 speed 2 30.6 speed.2 44 speed 2 40.6 speed 2 41.2 speed 2 32.7 speed 2 40.2 speed 2 43.2 speed 2 55.5 speed 2 55 speed 2 90.9 speed 2 71.3 speed 2 62.2 speed 2 33.5 speed 2 29.5 speed 2 322 speed 2 Sale Price DaysOnMarket 1110 50Plus 800 50Plus 900 50Plus 410 50Plus 789 50Plus 791 50Plus 180 50Plus 365 50Plus 1760 50Plus 330 50Plus 1330 50Plus 701 50Plus 770 50Plus 980 50Plus 995 50Plus 701 50Plus 1200 50Plus 270 50Plus 920 50Plus 1525 50Plus 310 50Plus 690 50Plus 1000 50Plus 841 50Plus 750 50Plus 2520 50Plus 1450 50Plus 1301 50Plus 1295 Under 50 1377 Under 50 880 Under 50 525 Under 50 1310 Under 50 1258 Under 50 656 Under 50 1255 Under 50 1390 Under 50 1131 Under 50 1590 Under 50 1766 Under 50 680 Underso 752 Under 50 835 Under 50 980 Under 1000 Under 50 1675 Underso 392 Under 50 387 Undert 865 Under 50 1495 Under 50 550 Under 50 622 Under 50 Question 1. 17 marks) (Chapter 31 A software company was developing a new computer game. The manager wanted to see what effect, if any, the speed setting of the game had on the length of time players survive in the game This information could then be used to develop combinations of settings so that consecutive levels of the computer game get more difficult. A large group of play-testers was available, most of whom already had some experience playing the new game, and each was randomly allocated a speed setting at which to play the game. The manager was particularly interested in comparing the mean survival time when the game was on speed setting 1 with that when it was on speed setting 2 The data for this comparison is stored in the file "Gamelvs2.csv" which can be downloaded from Canvas. The data contains 2 variables: The survival time for the player (in minutes) Speed The speed setting at which the software was running (either speed. 1 or speed. 2). Where speed. 1 is set at a lower the speed setting with a slower game speed Download the VIT Guide for Randomisation Tests from Canvas. Use the Guide while working on this question. Time (*) Briefly explain why this study is an experiment (1 Mark (b) 0 Run the VIT software and load the file Gamelva2.cavinto it Run a randomisation test to compare the mean survival times when the game was on speed setting I with that when it was on speed setting 2. Include the output fom this in your assignment answers [1 Mark GI) When chance is acting alone, estimate how unusual it is to get a difference in sample means at least as big as the observed difference in the experiment. Use your randomisation test output to answer this.) Il Mark) (In Is it plausible that the observed average difference in the mean survival times can be explained by chance acting alone"? Briefly justify your answer I Mark (lv) Can we conclude that changing the speed setting from 1 to 2 causes the average survival time to decrease? If so, justify why with two reasons. If not, what can we conclude? 13 Matic] Question 2. [7 marks) (Chapter 41 A researcher was interested in Aucklanders' opinions about rates and rate increases. He considered 3 different approaches to gathering information on this. Method 1: Randomly select 1,000 names from the Auckland phone book. Then hire a team of people to phone each person on the list and interview them. Method 2: Place advertisements in community papers asking people to go online and fill in a questionnaire Method 3: Use council records to assemble a list of all houses currently in Auckland City, Randomly select 1,000 houses from this list and post a questionnaire to each address asking the oldest person living in the house to fill in and return the questionnaire. [ Mark) [l Mark) (@) For which of the methods, if any, is non-response bias a potential problem? (b) For which of the methods, if any, is self-selection bias a potential problem? (C) Which of the methods, if any, is subject to interviewer effects? (d) Which of the methods, if any, is subject to sampling errors? (e) For each of the methods, give an example of why there may be selection bins. [1 mark] [1 mark) [3 Marko Question 3. [10 marks) (Chapter 51 A legal researcher was interested in the sale prices of houses in the Mt Eder/Epsom region of Auckland during 2013 to help with a dispute. He took a random sample of house sales in that region from February 2013 and recorded the price the house sold for along with the number of days the house was on the market. The data is stored in the file "Housesalesl.csv" which can be downloaded from Canvas. The data contains 2 variables: SalePrice The price the house sold foe (in thousands of dollars) DayaOnMarket The number of days the house was on the market Under 50: sold in less than 50 days 50Plus: sold in 50 or more days Download the VIT Guide for Bootstrapping from Canva Use the Guide while working on this question Run the VIT software and load the file Housesales.csvinto it Question 3 (continued) (a) () Generate a bootstrap confidence interval for the median sale price of houses in Mt Eden/Epsom sold during February, 2013. (DO NOT use the variable DaysOnMarket at this point.) Include the output in your assignment answers. [1 Mark) (1) What is the parameter we are estimating using this bootstrap confidence interval? | Mark] (it) Do we know the true value of this parameter? [1 Mark) (iv) Interpret the bootstrap confidence interval [I Mark) (w) Briefly explain why students doing this assignment will not all get the same bootstrap confidence interval [1 Mark] (b) (1) Generate a bootstrap confidence interval for the difference between the modian sale price of houses in Mt Eden/Epsom sold during February, 2013 that sold in less than 50 days on the market and the median sale price for those that sold in 50 or more days. Include the output in your assignment answers. [I Mark) (16) What is the parameter we are estimating using this bootstrap confidence interval? [1 Mark] (iii) Interpret the bootstrap confidence interval. [2 Marks) (iv) Based on the bootstrap confidence interval, is it plausible that the median sale price of houses in Mt Eden/Epsom sold during February, 2013 that sold in less than 50 days on the market and the median sale price for those that sold in 50 or more days could be the same? Briefly justify your answer TI Mark) Question 4. 17 marks) (Chapter 6 A statistics student was interested in investigating the average time it takes to get a pizza delivered to their house from the local pizzeria. Over a few weeks, a random sample of 10 delivery times (in minutes) was recorded. The data are displayed below: 20.3, 17.8, 23.1, 18.7, 24.7, 31.5, 22.3, 17.9, 20.3, 28.4 Summary Statistics: - 22.50 minutes and s=4.58. (a) Calculate and interpret a 95% confidence interval for the mean delivery time. [6 Marks) Note: You must clearly show that you have followed the "Step-by-Step Guide to Producing a Confidence Interval by Hand" given in the Lecture Workbook, Chapter 6. Use the procedures tool to find values for the s-multiplier and standard error (b) A friend of the statistics student pointed out to them that three of the ten pizza delivery times were below the lower value of the confidence interval so the pizza company is doing extremely well as you'd expect happen for less than 5% of the deliveries. Explain what was wrong with this thinking [1 Mark) Question 5. 19 marks) (Chapter 6] In 2010, PopCap Games commissioned a survey of adult mobile phone gamers in the United States and in the United Kingdom. A similar survey was also carried out in 2009. Some of the information from the survey is given below: Do you play mobile phone games for less 464 of the gamers surveyed in 2010 had than 60 minutes per week? recommended games to others. This group 2009: Yes (521) Total (659) was asked what influenced them to recommend a game. They could choose as 2010: Yes (554) Total (814) many answers as they wished. The answers, with the percentages, selecting them were: How often do you typically play on your 33% From a trusted brand mobile phone? 38% Controls simple to use 2009 2010 49% Easy to learn Daily 86 284 86% Fun to play 2-3 times per week 119 296 40% Good value once a week 59 108 36% Great graphics and sound 2-3 times a month 72 83 45% Is challenging once a month or less 323 41% Lots of levels/modes Total 659 814 (a) State the sampling situation (a, b ore) for calculating the standard error of the difference in the following scenarios: (1) estimating the difference between the proportion of gamers that played for less than 60 minutes per week in 2009 and the proportion of gamers that played for less than 60 minutes per week in 2010 (1) estimating the difference between the proportion of gamers that played for at least 60 minutes per week in 2010 and the proportion of gamers that played daily in 2010. (ii) for gamers who recommend games to others, estimating the difference between the proportion of all gamers who, in 2010, would have recommended a game that is fun to play and the proportion of all gamers who, in 2010, would have recommended a game that is casy to leam. 13 Marks b) Calculate and interpret a 95% confidence interval for the difference between the proportion of gamers that played daily in 2010 and the proportion of gamers that played daily in 2009 16 Mars] Note: You must clearly show that you have followed the step-by-step guide to producing a confidence interval by hand" given in the Lecture Workbook, Chapter 6. Use the procedures tool to find values for multipliers and standard errors. Page 3 Time Speed 37.7 speed. 1 77.4 speed. 1 50 speed. 1 70.2 speed. 1 81.9 speed. 1 53.9 speed. 1 64.6 speed. 1 64.7 speed. 1 58.4 speed. 1 41.4 speed. 1 76.4 speed. 1 92.9 speed. 1 61.3 speed. 1 38.3 speed. 1 65,5 speed. 1 79.9 speed. 1 74.3 speed. 1 43.9 speed. 1 27.5 speed. 1 36.1 speed, 1 50.1 speed. 1 49.3 speed. 1 57.7 speed. 1 61.1 speed. 1 442 speed. 1 53 speed. 1 48.9 speed. 1 71.5 speed.2 41.9 speed. 2 28.9 speed 2 71,5 speed 2 51.4 speed 2 84.5 speed.2 48.7 speed.2 92.9 speed 2 87.5 speed.2 51.9 speed 2 57 speed. 2 26 2 speed. 2 30.6 speed 2 44 speed 2 40.6 speed.2 41.2 speed 2 32.7 speed. 2 40.2 speed. 2 43.2 speed.2 55.5 speed 2 55 speed 2 90.9 speed 2 71.3 speed.2 62.2 speed 2 33,5 speed 2 29.5 speed 2 32 2 speed 2 Sale Price DaysOnMarket 1110 50Plus 800 50Plus 900 50Plus 410 50Plus 789 50Plus 791 50Plus 180 50Plus 365 50Plus 1760 50Plus 330 50Plus 1330 50 Plus 701 50Plus 770 50Plus 980 50 Plus 995 50Plus 701 50Plus 1200 50Plus 270 50Plus 920 50Plus 1525 50Plus 310 50Plus 690 50Plus 1000 50Plus 841 50Plus 750 50Plus 2520 50Plus 1450 50Plus 1301 50Plus 1295 Under 50 1377 Under 50 880 Under 50 525 Under 50 1310 Under 50 1258 Under 50 656 Under 50 1255 Under 50 1390 Under 50 1131 Under50 1590 Under 50 1766 Under 50 680 Under 50 752 Under 50 835 Under 50 980 Under 50 1000 Under 50 1675 Under 50 392 Under 50 387 Under 50 865 Under50 1495 Under 50 550 Under 50 622 Under 50 Question 1. 17 marks] (Chapter 3] A software company was developing a new computer game. The manager wanted to see what effect, if any, the speed setting of the game had on the length of time players survive in the game. This information could then be used to develop combinations of settings so that consecutive levels of the computer game get more difficult. A large group of play-testers was available, most of whom already had some experience playing the new game, and each was randomly allocated a speed setting at which to play the game. The manager was particularly interested in comparing the mean survival time when the game was on speed setting 1 with that when it was on speed setting 2. The data for this comparison is stored in the file "Gamelvs2.csv" which can be downloaded from Canvas. The data contains 2 variables: The survival time for the player (in minutes) Speed The speed setting at which the software was running (either speed. 1 or speed. 2). Where speed. 1 is set at a lower the speed setting with a slower game speed Download the VIT Guide for Randomisation Tests from Canvas. Use the Guide while working on this question Time (a) Briefly explain why this study is an experiment. [1 Mark) (b) () Run the VIT software and load the file Gamelvs2.csv into it. Run a randomisation test to compare the mean survival times when the game was on speed setting 1 with that when it was on speed setting 2. Include the output from this in your assignment answers [1 Mark) (1) When chance is acting alone, estimate how unusual it is to get a difference in sample means at least as big as the observed difference in the experiment. (Use your randomisation test output to answer this.) [1 Mark) (1) Is it plausible that the observed average difference in the mean survival times can be explained by "chance acting alone"? Briefly justify your answer. [I Mark) (iv) Can we conclude that changing the speed setting from 1 to 2 causes the average survival time to decrease? If so, justify why with two reasons. If not, what can we conclude? (3 Marks) Time Speed 37.7 speed. 1 77.4 speed. 1 50 speed. 1 70.2 speed. 1 81.9 speed. 1 53.9 speed. 1 64.6 speed. 1 64.7 speed. 1 58.4 speed. 1 41.4 speed. 1 76.4 speed. 1 92.9 speed. 1 61.3 speed. 1 38.3 speed. 1 65.5 speed. 1 79.9 speed. 1 74.3 speed. 1 43.9 speed. 1 275 speed. 1 36.1 speed. 1 50.1 speed. 1 49.3 speed. 1 57.7 speed. 1 61.1 speed. 1 44.2 speed. 1 53 speed. 1 48.9 speed. 1 71.5 speed 2 41.9 speed 2 28.9 speed 2 71,5 speed 2 51.4 speed 2 84.5 speed 2 48.7 speed 2 92.9 speed 2 87.5 speed 2 51.9 speed 2 57 speed 2 26.2 speed.2 30.6 speed 2 44 speed 2 406 speed 2 412 speed 2 32.7 speed 2 40.2 speed 2 43.2 speed 2 55.5 speed 2 56 speed 2 90.9 speed 2 713 speed 2 622 speed 2 33.5 speed 2 29.5 speed 2 322 speed 2 1.17 marial Chapter 41 Asher ward Auckland place where and we coded different approaches to bring to this Method It Randomly select 1.000m from the Auckland shock. There at of people that eachers in the last view the Metod Place advertise in commonly papers in people to read Question 1.17 mars Chapter 31 A www.copy was developing new compunere Theme wasted to me what act, if y, the edge of the law the ghoftim players in the game This information the bed to developinions of sings so that come level of the compune difficult. A large proup of players wat will most of whom hrady had experience playing the new game, and each wadonly allowed spoling at which to play the The manager was particularly interested in comparing the mean turvival time when the new spending with that when it was on pedig The us for this companies tored in the file canela.wtich an be downloaded to Carra, Thedas contas 2 variables Tine The survival time for the player in mine) Speed The speed wetting at which the software warming the speed. 1 wpeed. 2) Wheer speed. 1 lower the speeding with lower Method will to some list of all house in Auckland Clay Randomly welet 1.000 homes from this list and post questions to each with oldes en living in the ho illis and the gloria 11 For which of the method, if any, mehi penal problem? Par which of the method, if any, well in a potential problem! Which of the method if y, tu saject to interviewerfect (4) Which of the method, any, a je to sampling ? *) For each of the methods, we in example of why they may be sluction bu Download EVIT Guide for Radiation Tests from Canvas Uw the Ouide while working on this question IM 13 Bly explain why this study is an experimen a) un the VIT ownload the analys2.win it Rusdominent to compare the mean survival times when the newed I with that when it was speed setting 2. Include the output from this to your Mail 0 When chance is acting alone, imate how is to get a difference is ample www big as the herved difference in the experiment your resume test output to werth) W la plenible that the served avenge difference in the survival mes ante explained by chance ating Alone Bridly ify your wwwer Mest Question. 10 markal Chapter All her in the sale prion of houses in the Midnom region of Auckland during 2015 to help with a disput. He took a tudom sample of home sales in that from February 2013 and recorded the price the old for some with the number of days the one the market The dann is stored in the file hostel.cur which can be downloaded from Cana. The data con 2 variables Salice There howed for those of dollar) Day Market The umber of day that the market Under 50 sold in less than 30 days sols sold in 0 m dys O Casa comelade but changing the speeding them to comes the wengi e del fily why with two on. not, what can we concede? Download the VIT Guide for trapping from Us Guide while won question In the IT and the file housesalent.cn para WEATS Our Chap 2014 www wwwwwwww Q (N) Cabello mediale price of his M Wimm dry, 2011. DO NOT the Day lak IMA When the per we are imbra twowth www of this hthebop concert 11 (W Brittly auptain ety alai ce IM Dely han of the la w The wwwww www.They wwwy wed The Yal 300. Ya 15540 T10 while 2000 2010 495 wy ow D 34 29 an en beendence de thee of in Medgy, 2013 had the media prohinclude est in your IMA 00 What is the power Interpreted aralia to home home in prehry, 2013 was so are nilae natural parties that all 30 ye male he is a 10 13 2-3 49 GINE 41 Bingo Ding the rest per week in 2009 and report on the per week in 2000 - a team 2016 e proprio dalle white 2010, played the power 4. Imara Chapter Aiden asinsvegg the wind e house to the local para Orafowanie of 10 recordedThe displayed 20.), 17.1. 23.1. 18.1, 2.1, 3.1, 3), 13., 20., 21.6 Summary Studies - 158 Csendintcoinerval for the wym Note: You must clearly that you have followed the suplyse des Producing Cofidence level by Handel in the Workbook Chapter tool to find the whiplerinden Athenefeld at the theme of in delivery a helease the marina pa pa ly wallpaper for loss than of the deliver Explain what we wong wit Contattare for the free here te proporti You show the lowed by Water formada Time Speed 37.7 speed. 1 77.4 speed. 1 50 speed. 1 70.2 speed. 1 81.9 speed. 1 53.9 speed. 1 84.6 speed. 1 64.7 speed. 1 58.4 speed. 1 41.4 speed. 1 76.4 speed. 1 92.9 speed. 1 61.3 spood. 1 38.3 spoed. 1 65.5 speed. 1 79.9 speed. 1 74.3 speed. 1 43.9 speed. 1 27.5 speed, 1 36.1 speed. 1 50.1 speed. 1 49.3 speed. 1 57.7 speed. 1 61.1 speed. 1 44.2 speed. 1 53 speed. 1 48.9 speed. 1 71.5 speed 2 41.9 speed 2 28.9 speed 2 71.5 speed 2 51.4 speed.2 84.5 speed.2 48.7 speed.2 92.9 speed.2 87.5 speed 2 519 speed 2 57 speed 2 26.2 speed 2 30.6 speed.2 44 speed 2 40.6 speed 2 41.2 speed 2 32.7 speed 2 40.2 speed 2 43.2 speed 2 55.5 speed 2 55 speed 2 90.9 speed 2 71.3 speed 2 62.2 speed 2 33.5 speed 2 29.5 speed 2 322 speed 2 Sale Price DaysOnMarket 1110 50Plus 800 50Plus 900 50Plus 410 50Plus 789 50Plus 791 50Plus 180 50Plus 365 50Plus 1760 50Plus 330 50Plus 1330 50Plus 701 50Plus 770 50Plus 980 50Plus 995 50Plus 701 50Plus 1200 50Plus 270 50Plus 920 50Plus 1525 50Plus 310 50Plus 690 50Plus 1000 50Plus 841 50Plus 750 50Plus 2520 50Plus 1450 50Plus 1301 50Plus 1295 Under 50 1377 Under 50 880 Under 50 525 Under 50 1310 Under 50 1258 Under 50 656 Under 50 1255 Under 50 1390 Under 50 1131 Under 50 1590 Under 50 1766 Under 50 680 Underso 752 Under 50 835 Under 50 980 Under 1000 Under 50 1675 Underso 392 Under 50 387 Undert 865 Under 50 1495 Under 50 550 Under 50 622 Under 50 Question 1. 17 marks) (Chapter 31 A software company was developing a new computer game. The manager wanted to see what effect, if any, the speed setting of the game had on the length of time players survive in the game This information could then be used to develop combinations of settings so that consecutive levels of the computer game get more difficult. A large group of play-testers was available, most of whom already had some experience playing the new game, and each was randomly allocated a speed setting at which to play the game. The manager was particularly interested in comparing the mean survival time when the game was on speed setting 1 with that when it was on speed setting 2 The data for this comparison is stored in the file "Gamelvs2.csv" which can be downloaded from Canvas. The data contains 2 variables: The survival time for the player (in minutes) Speed The speed setting at which the software was running (either speed. 1 or speed. 2). Where speed. 1 is set at a lower the speed setting with a slower game speed Download the VIT Guide for Randomisation Tests from Canvas. Use the Guide while working on this question. Time (*) Briefly explain why this study is an experiment (1 Mark (b) 0 Run the VIT software and load the file Gamelva2.cavinto it Run a randomisation test to compare the mean survival times when the game was on speed setting I with that when it was on speed setting 2. Include the output fom this in your assignment answers [1 Mark GI) When chance is acting alone, estimate how unusual it is to get a difference in sample means at least as big as the observed difference in the experiment. Use your randomisation test output to answer this.) Il Mark) (In Is it plausible that the observed average difference in the mean survival times can be explained by chance acting alone"? Briefly justify your answer I Mark (lv) Can we conclude that changing the speed setting from 1 to 2 causes the average survival time to decrease? If so, justify why with two reasons. If not, what can we conclude? 13 Matic] Question 2. [7 marks) (Chapter 41 A researcher was interested in Aucklanders' opinions about rates and rate increases. He considered 3 different approaches to gathering information on this. Method 1: Randomly select 1,000 names from the Auckland phone book. Then hire a team of people to phone each person on the list and interview them. Method 2: Place advertisements in community papers asking people to go online and fill in a questionnaire Method 3: Use council records to assemble a list of all houses currently in Auckland City, Randomly select 1,000 houses from this list and post a questionnaire to each address asking the oldest person living in the house to fill in and return the questionnaire. [ Mark) [l Mark) (@) For which of the methods, if any, is non-response bias a potential problem? (b) For which of the methods, if any, is self-selection bias a potential problem? (C) Which of the methods, if any, is subject to interviewer effects? (d) Which of the methods, if any, is subject to sampling errors? (e) For each of the methods, give an example of why there may be selection bins. [1 mark] [1 mark) [3 Marko Question 3. [10 marks) (Chapter 51 A legal researcher was interested in the sale prices of houses in the Mt Eder/Epsom region of Auckland during 2013 to help with a dispute. He took a random sample of house sales in that region from February 2013 and recorded the price the house sold for along with the number of days the house was on the market. The data is stored in the file "Housesalesl.csv" which can be downloaded from Canvas. The data contains 2 variables: SalePrice The price the house sold foe (in thousands of dollars) DayaOnMarket The number of days the house was on the market Under 50: sold in less than 50 days 50Plus: sold in 50 or more days Download the VIT Guide for Bootstrapping from Canva Use the Guide while working on this question Run the VIT software and load the file Housesales.csvinto it Question 3 (continued) (a) () Generate a bootstrap confidence interval for the median sale price of houses in Mt Eden/Epsom sold during February, 2013. (DO NOT use the variable DaysOnMarket at this point.) Include the output in your assignment answers. [1 Mark) (1) What is the parameter we are estimating using this bootstrap confidence interval? | Mark] (it) Do we know the true value of this parameter? [1 Mark) (iv) Interpret the bootstrap confidence interval [I Mark) (w) Briefly explain why students doing this assignment will not all get the same bootstrap confidence interval [1 Mark] (b) (1) Generate a bootstrap confidence interval for the difference between the modian sale price of houses in Mt Eden/Epsom sold during February, 2013 that sold in less than 50 days on the market and the median sale price for those that sold in 50 or more days. Include the output in your assignment answers. [I Mark) (16) What is the parameter we are estimating using this bootstrap confidence interval? [1 Mark] (iii) Interpret the bootstrap confidence interval. [2 Marks) (iv) Based on the bootstrap confidence interval, is it plausible that the median sale price of houses in Mt Eden/Epsom sold during February, 2013 that sold in less than 50 days on the market and the median sale price for those that sold in 50 or more days could be the same? Briefly justify your answer TI Mark) Question 4. 17 marks) (Chapter 6 A statistics student was interested in investigating the average time it takes to get a pizza delivered to their house from the local pizzeria. Over a few weeks, a random sample of 10 delivery times (in minutes) was recorded. The data are displayed below: 20.3, 17.8, 23.1, 18.7, 24.7, 31.5, 22.3, 17.9, 20.3, 28.4 Summary Statistics: - 22.50 minutes and s=4.58. (a) Calculate and interpret a 95% confidence interval for the mean delivery time. [6 Marks) Note: You must clearly show that you have followed the "Step-by-Step Guide to Producing a Confidence Interval by Hand" given in the Lecture Workbook, Chapter 6. Use the procedures tool to find values for the s-multiplier and standard error (b) A friend of the statistics student pointed out to them that three of the ten pizza delivery times were below the lower value of the confidence interval so the pizza company is doing extremely well as you'd expect happen for less than 5% of the deliveries. Explain what was wrong with this thinking [1 Mark) Question 5. 19 marks) (Chapter 6] In 2010, PopCap Games commissioned a survey of adult mobile phone gamers in the United States and in the United Kingdom. A similar survey was also carried out in 2009. Some of the information from the survey is given below: Do you play mobile phone games for less 464 of the gamers surveyed in 2010 had than 60 minutes per week? recommended games to others. This group 2009: Yes (521) Total (659) was asked what influenced them to recommend a game. They could choose as 2010: Yes (554) Total (814) many answers as they wished. The answers, with the percentages, selecting them were: How often do you typically play on your 33% From a trusted brand mobile phone? 38% Controls simple to use 2009 2010 49% Easy to learn Daily 86 284 86% Fun to play 2-3 times per week 119 296 40% Good value once a week 59 108 36% Great graphics and sound 2-3 times a month 72 83 45% Is challenging once a month or less 323 41% Lots of levels/modes Total 659 814 (a) State the sampling situation (a, b ore) for calculating the standard error of the difference in the following scenarios: (1) estimating the difference between the proportion of gamers that played for less than 60 minutes per week in 2009 and the proportion of gamers that played for less than 60 minutes per week in 2010 (1) estimating the difference between the proportion of gamers that played for at least 60 minutes per week in 2010 and the proportion of gamers that played daily in 2010. (ii) for gamers who recommend games to others, estimating the difference between the proportion of all gamers who, in 2010, would have recommended a game that is fun to play and the proportion of all gamers who, in 2010, would have recommended a game that is casy to leam. 13 Marks b) Calculate and interpret a 95% confidence interval for the difference between the proportion of gamers that played daily in 2010 and the proportion of gamers that played daily in 2009 16 Mars] Note: You must clearly show that you have followed the step-by-step guide to producing a confidence interval by hand" given in the Lecture Workbook, Chapter 6. Use the procedures tool to find values for multipliers and standard errors. Page 3 Time Speed 37.7 speed. 1 77.4 speed. 1 50 speed. 1 70.2 speed. 1 81.9 speed. 1 53.9 speed. 1 64.6 speed. 1 64.7 speed. 1 58.4 speed. 1 41.4 speed. 1 76.4 speed. 1 92.9 speed. 1 61.3 speed. 1 38.3 speed. 1 65,5 speed. 1 79.9 speed. 1 74.3 speed. 1 43.9 speed. 1 27.5 speed. 1 36.1 speed, 1 50.1 speed. 1 49.3 speed. 1 57.7 speed. 1 61.1 speed. 1 442 speed. 1 53 speed. 1 48.9 speed. 1 71.5 speed.2 41.9 speed. 2 28.9 speed 2 71,5 speed 2 51.4 speed 2 84.5 speed.2 48.7 speed.2 92.9 speed 2 87.5 speed.2 51.9 speed 2 57 speed. 2 26 2 speed. 2 30.6 speed 2 44 speed 2 40.6 speed.2 41.2 speed 2 32.7 speed. 2 40.2 speed. 2 43.2 speed.2 55.5 speed 2 55 speed 2 90.9 speed 2 71.3 speed.2 62.2 speed 2 33,5 speed 2 29.5 speed 2 32 2 speed 2 Sale Price DaysOnMarket 1110 50Plus 800 50Plus 900 50Plus 410 50Plus 789 50Plus 791 50Plus 180 50Plus 365 50Plus 1760 50Plus 330 50Plus 1330 50 Plus 701 50Plus 770 50Plus 980 50 Plus 995 50Plus 701 50Plus 1200 50Plus 270 50Plus 920 50Plus 1525 50Plus 310 50Plus 690 50Plus 1000 50Plus 841 50Plus 750 50Plus 2520 50Plus 1450 50Plus 1301 50Plus 1295 Under 50 1377 Under 50 880 Under 50 525 Under 50 1310 Under 50 1258 Under 50 656 Under 50 1255 Under 50 1390 Under 50 1131 Under50 1590 Under 50 1766 Under 50 680 Under 50 752 Under 50 835 Under 50 980 Under 50 1000 Under 50 1675 Under 50 392 Under 50 387 Under 50 865 Under50 1495 Under 50 550 Under 50 622 Under 50 Question 1. 17 marks] (Chapter 3] A software company was developing a new computer game. The manager wanted to see what effect, if any, the speed setting of the game had on the length of time players survive in the game. This information could then be used to develop combinations of settings so that consecutive levels of the computer game get more difficult. A large group of play-testers was available, most of whom already had some experience playing the new game, and each was randomly allocated a speed setting at which to play the game. The manager was particularly interested in comparing the mean survival time when the game was on speed setting 1 with that when it was on speed setting 2. The data for this comparison is stored in the file "Gamelvs2.csv" which can be downloaded from Canvas. The data contains 2 variables: The survival time for the player (in minutes) Speed The speed setting at which the software was running (either speed. 1 or speed. 2). Where speed. 1 is set at a lower the speed setting with a slower game speed Download the VIT Guide for Randomisation Tests from Canvas. Use the Guide while working on this question Time (a) Briefly explain why this study is an experiment. [1 Mark) (b) () Run the VIT software and load the file Gamelvs2.csv into it. Run a randomisation test to compare the mean survival times when the game was on speed setting 1 with that when it was on speed setting 2. Include the output from this in your assignment answers [1 Mark) (1) When chance is acting alone, estimate how unusual it is to get a difference in sample means at least as big as the observed difference in the experiment. (Use your randomisation test output to answer this.) [1 Mark) (1) Is it plausible that the observed average difference in the mean survival times can be explained by "chance acting alone"? Briefly justify your answer. [I Mark) (iv) Can we conclude that changing the speed setting from 1 to 2 causes the average survival time to decrease? If so, justify why with two reasons. If not, what can we conclude? (3 Marks) Time Speed 37.7 speed. 1 77.4 speed. 1 50 speed. 1 70.2 speed. 1 81.9 speed. 1 53.9 speed. 1 64.6 speed. 1 64.7 speed. 1 58.4 speed. 1 41.4 speed. 1 76.4 speed. 1 92.9 speed. 1 61.3 speed. 1 38.3 speed. 1 65.5 speed. 1 79.9 speed. 1 74.3 speed. 1 43.9 speed. 1 275 speed. 1 36.1 speed. 1 50.1 speed. 1 49.3 speed. 1 57.7 speed. 1 61.1 speed. 1 44.2 speed. 1 53 speed. 1 48.9 speed. 1 71.5 speed 2 41.9 speed 2 28.9 speed 2 71,5 speed 2 51.4 speed 2 84.5 speed 2 48.7 speed 2 92.9 speed 2 87.5 speed 2 51.9 speed 2 57 speed 2 26.2 speed.2 30.6 speed 2 44 speed 2 406 speed 2 412 speed 2 32.7 speed 2 40.2 speed 2 43.2 speed 2 55.5 speed 2 56 speed 2 90.9 speed 2 713 speed 2 622 speed 2 33.5 speed 2 29.5 speed 2 322 speed 2
Step by Step Solution
There are 3 Steps involved in it

Get step-by-step solutions from verified subject matter experts