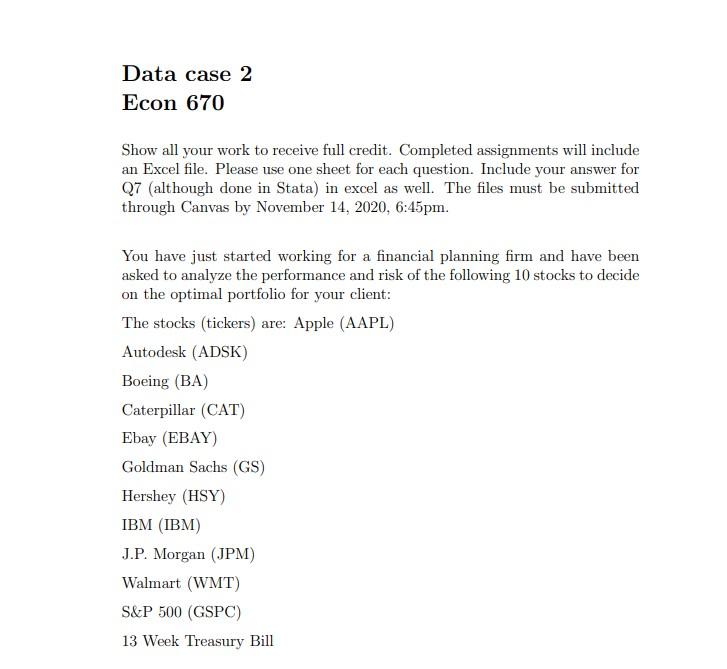
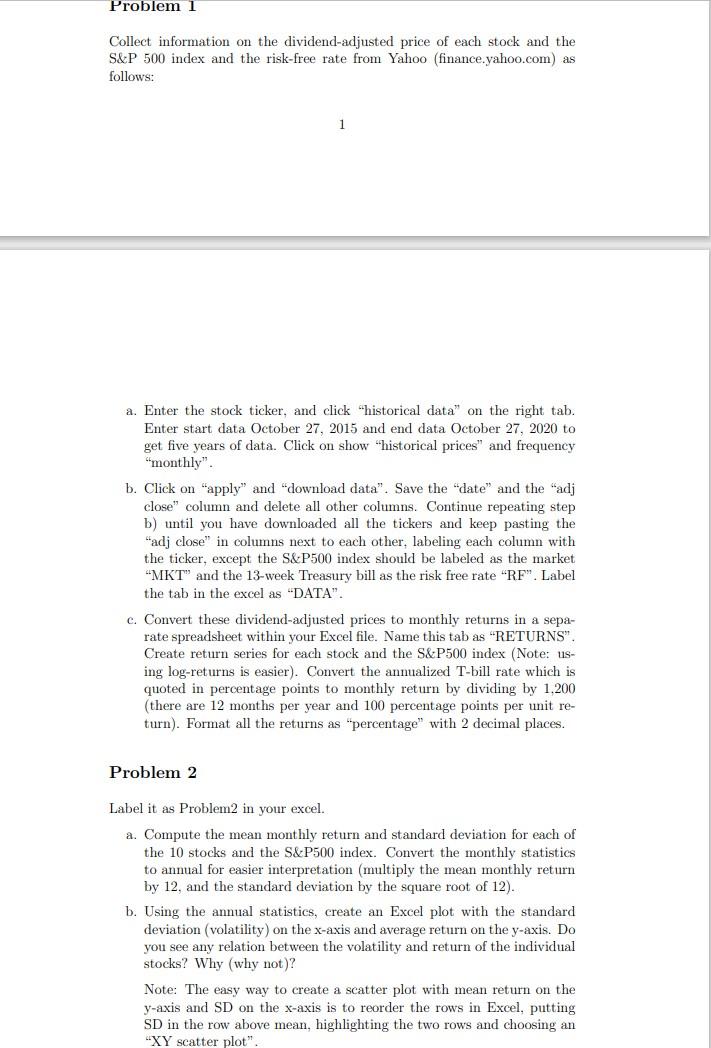
Data case 2 Econ 670 Show all your work to receive full credit. Completed assignments will include an Excel file. Please use one sheet for each question. Include your answer for Q7 (although done in Stata) in excel as well. The files must be submitted through Canvas by November 14, 2020, 6:45pm. You have just started working for a financial planning firm and have been asked to analyze the performance and risk of the following 10 stocks to decide on the optimal portfolio for your client: The stocks (tickers) are: Apple (AAPL) Autodesk (ADSK) Boeing (BA) Caterpillar (CAT) Ebay (EBAY) Goldman Sachs (GS) Hershey (HSY) IBM (IBM) J.P. Morgan (JPM) Walmart (WMT) S&P 500 (GSPC) 13 Week Treasury Bill Problem Collect information on the dividend-adjusted price of each stock and the S&P 500 index and the risk-free rate from Yahoo (finance.yahoo.com) as follows: 1 a. Enter the stock ticker, and click "historical data" on the right tab. Enter start data October 27, 2015 and end data October 27, 2020 to get five years of data. Click on show "historical prices" and frequency nonthly". b. Click on "apply" and "download data". Save the "date" and the "adj close" column and delete all other columns. Continue repeating step b) until you have downloaded all the tickers and keep pasting the "adj close" in columns next to each other, labeling each column with the ticker, except the S&P500 index should be labeled as the market "MKT" and the 13-week Treasury bill as the risk free rate "RF". Label the tab in the excel as "DATA". c. Convert these dividend-adjusted prices to monthly returns in a sepa- rate spreadsheet within your Excel file. Name this tab as "RETURNS". Create return series for each stock and the S&P500 index (Note: us- ing log-returns is easier). Convert the annualized T-bill rate which is quoted in percentage points to monthly return by dividing by 1,200 (there are 12 months per year and 100 percentage points per unit re- turn). Format all the returns as "percentage" with 2 decimal places. Problem 2 Label it as Problem2 in your excel. a. Compute the mean monthly return and standard deviation for each of the 10 stocks and the S&P500 index. Convert the monthly statistics to annual for easier interpretation multiply the mean monthly return by 12, and the standard deviation by the square root of 12). b. Using the annual statistics, create an Excel plot with the standard deviation (volatility) on the x-axis and average return on the y-axis. Do you see any relation between the volatility and return of the individual stocks? Why why not)? Note: The easy way to create a scatter plot with mean return on the y-axis and SD on the x-axis is to reorder the rows in Excel, putting SD in the row above mean, highlighting the two rows and choosing an "XY scatter plot" Data case 2 Econ 670 Show all your work to receive full credit. Completed assignments will include an Excel file. Please use one sheet for each question. Include your answer for Q7 (although done in Stata) in excel as well. The files must be submitted through Canvas by November 14, 2020, 6:45pm. You have just started working for a financial planning firm and have been asked to analyze the performance and risk of the following 10 stocks to decide on the optimal portfolio for your client: The stocks (tickers) are: Apple (AAPL) Autodesk (ADSK) Boeing (BA) Caterpillar (CAT) Ebay (EBAY) Goldman Sachs (GS) Hershey (HSY) IBM (IBM) J.P. Morgan (JPM) Walmart (WMT) S&P 500 (GSPC) 13 Week Treasury Bill Problem Collect information on the dividend-adjusted price of each stock and the S&P 500 index and the risk-free rate from Yahoo (finance.yahoo.com) as follows: 1 a. Enter the stock ticker, and click "historical data" on the right tab. Enter start data October 27, 2015 and end data October 27, 2020 to get five years of data. Click on show "historical prices" and frequency nonthly". b. Click on "apply" and "download data". Save the "date" and the "adj close" column and delete all other columns. Continue repeating step b) until you have downloaded all the tickers and keep pasting the "adj close" in columns next to each other, labeling each column with the ticker, except the S&P500 index should be labeled as the market "MKT" and the 13-week Treasury bill as the risk free rate "RF". Label the tab in the excel as "DATA". c. Convert these dividend-adjusted prices to monthly returns in a sepa- rate spreadsheet within your Excel file. Name this tab as "RETURNS". Create return series for each stock and the S&P500 index (Note: us- ing log-returns is easier). Convert the annualized T-bill rate which is quoted in percentage points to monthly return by dividing by 1,200 (there are 12 months per year and 100 percentage points per unit re- turn). Format all the returns as "percentage" with 2 decimal places. Problem 2 Label it as Problem2 in your excel. a. Compute the mean monthly return and standard deviation for each of the 10 stocks and the S&P500 index. Convert the monthly statistics to annual for easier interpretation multiply the mean monthly return by 12, and the standard deviation by the square root of 12). b. Using the annual statistics, create an Excel plot with the standard deviation (volatility) on the x-axis and average return on the y-axis. Do you see any relation between the volatility and return of the individual stocks? Why why not)? Note: The easy way to create a scatter plot with mean return on the y-axis and SD on the x-axis is to reorder the rows in Excel, putting SD in the row above mean, highlighting the two rows and choosing an "XY scatter plot