Answered step by step
Verified Expert Solution
Question
1 Approved Answer
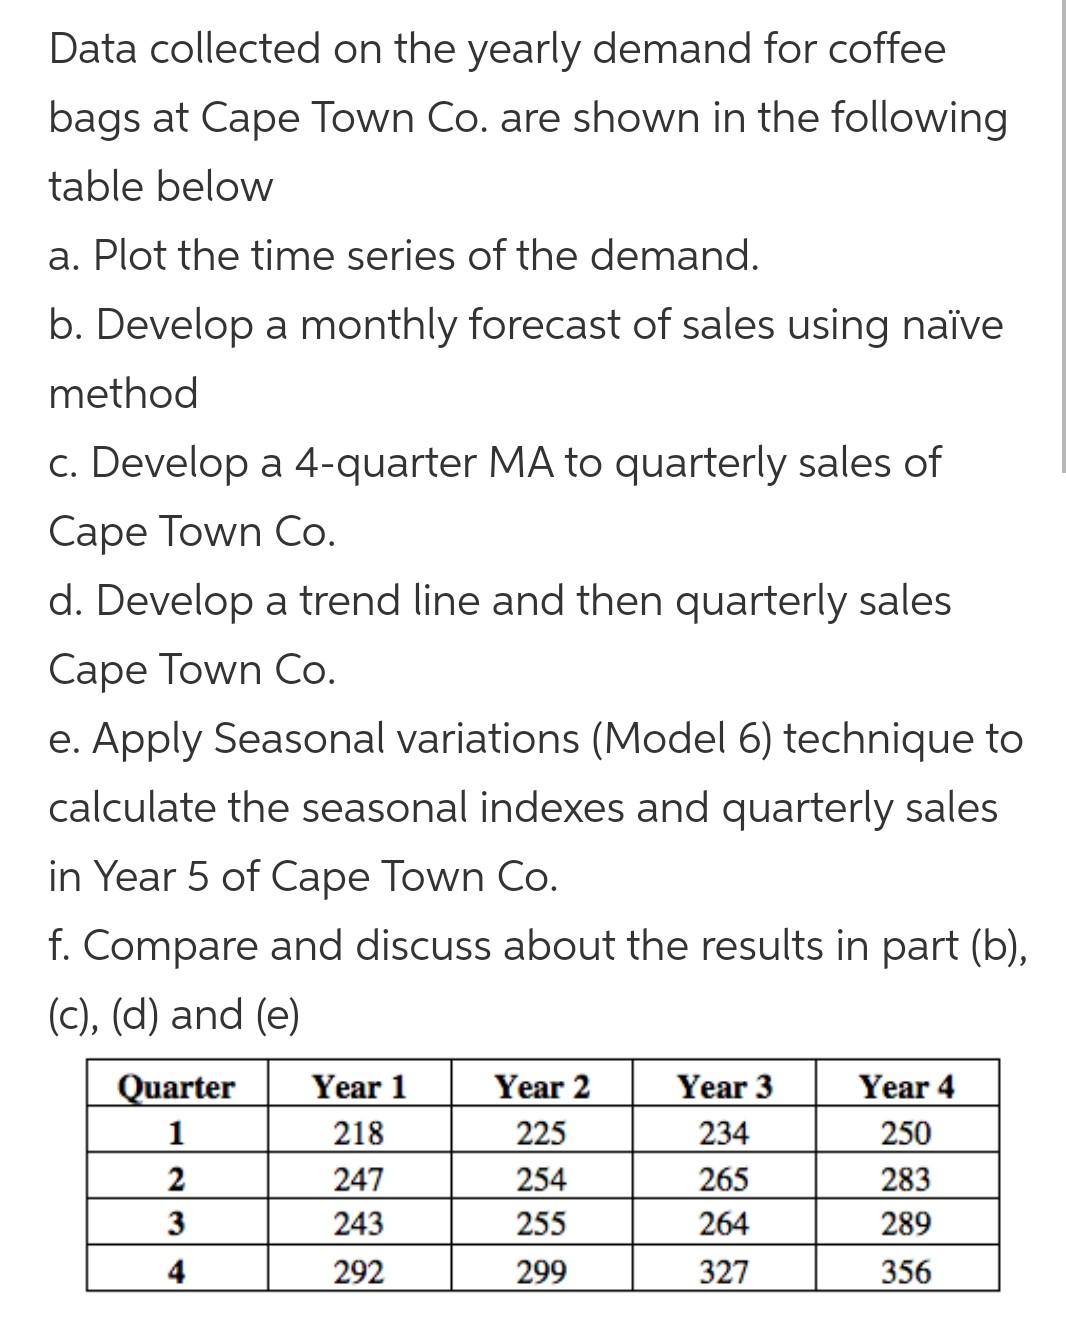
Data collected on the yearly demand for coffee bags at Cape Town Co. are shown in the following table below a. Plot the time series

Data collected on the yearly demand for coffee bags at Cape Town Co. are shown in the following table below a. Plot the time series of the demand. b. Develop a monthly forecast of sales using nave method c. Develop a 4-quarter MA to quarterly sales of Cape Town Co. d. Develop a trend line and then quarterly sales Cape Town Co. e. Apply Seasonal variations (Model 6) technique to calculate the seasonal indexes and quarterly sales in Year 5 of Cape Town Co. f. Compare and discuss about the results in part (b), (c), (d) and (e) Quarter 1 2 3 4 Year 1 218 247 243 292 Year 2 225 254 255 299 Year 3 234 265 264 327 Year 4 250 283 289 356
Step by Step Solution
There are 3 Steps involved in it
Step: 1

Get Instant Access to Expert-Tailored Solutions
See step-by-step solutions with expert insights and AI powered tools for academic success
Step: 2

Step: 3

Ace Your Homework with AI
Get the answers you need in no time with our AI-driven, step-by-step assistance
Get Started


