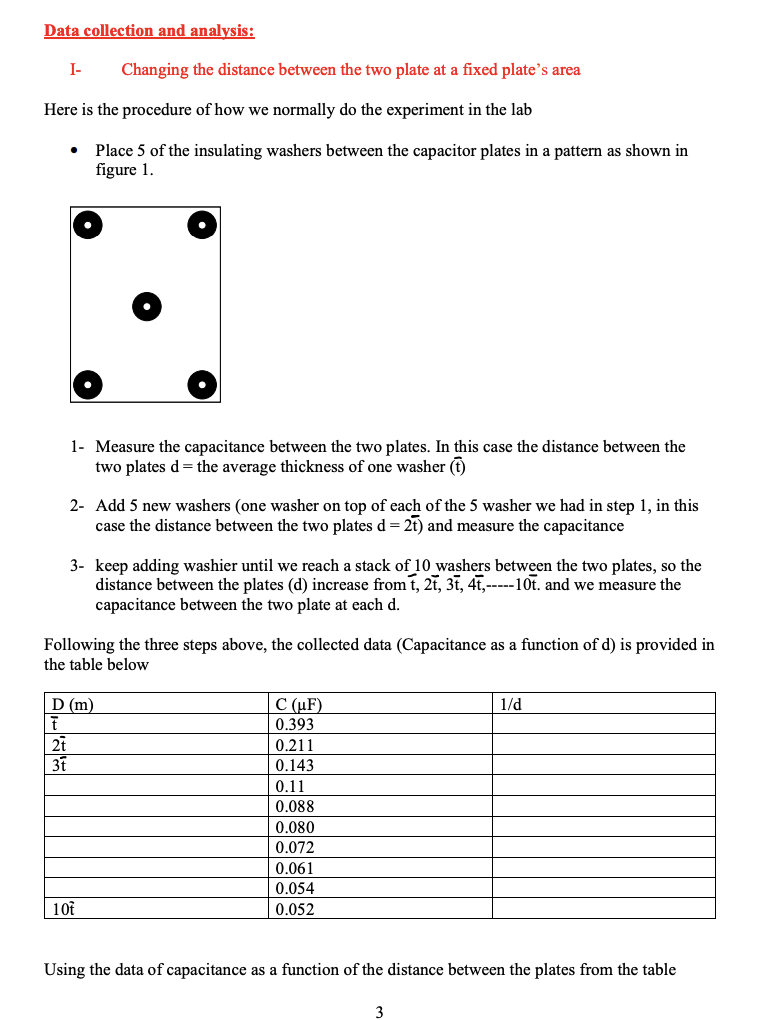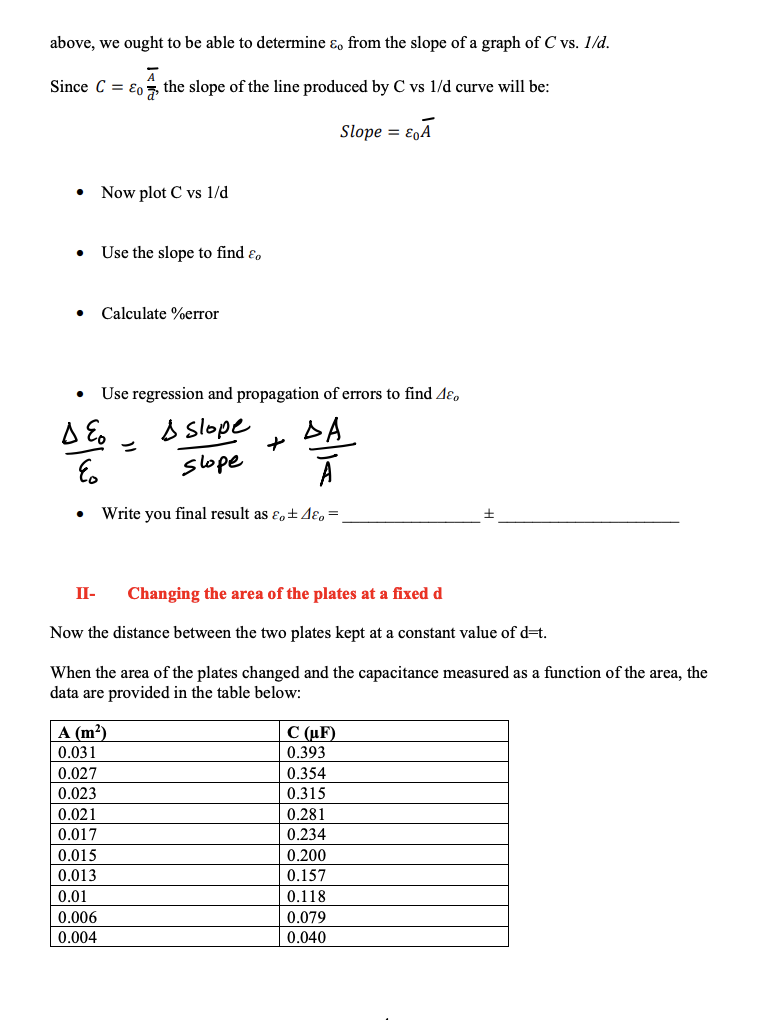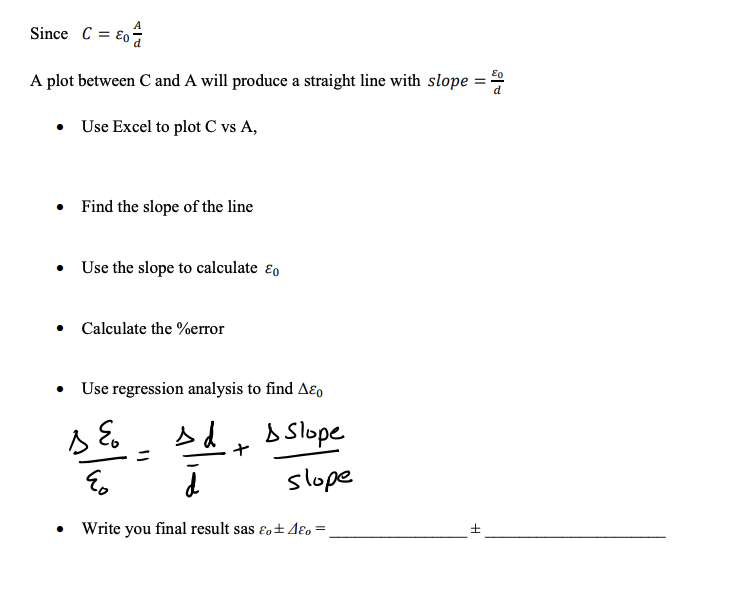


Data collection and analysis: I- Changing the distance between the two plate at a fixed plate's area Here is the procedure of how we normally do the experiment in the lab Place 5 of the insulating washers between the capacitor plates in a pattern as shown in figure 1. 1- Measure the capacitance between the two plates. In this case the distance between the two plates d = the average thickness of one washer ) 2- Add 5 new washers (one washer on top of each of the 5 washer we had in step 1, in this case the distance between the two plates d = 27) and measure the capacitance 3- keep adding washier until we reach a stack of 10 washers between the two plates, so the distance between the plates (d) increase from 1, 27, 37, 47,-----10t. and we measure the capacitance between the two plate at each d. Following the three steps above, the collected data (Capacitance as a function of d) is provided in the table below 1/d D (m) t 2t 3t C (UF) 0.393 0.211 0.143 0.11 0.088 0.080 0.072 0.061 0.054 0.052 101 Using the data of capacitance as a function of the distance between the plates from the table above, we ought to be able to determine &, from the slope of a graph of C vs. 1/d. Since C = o the slope of the line produced by C vs 1/d curve will be: Slope = {A Now plot C vs 1/d . Use the slope to find Calculate %error . Use regression and propagation of errors to find 4, A&o & slope DA E slope Write you final result as , 4, = II- Changing the area of the plates at a fixed d Now the distance between the two plates kept at a constant value of d=t. When the area of the plates changed and the capacitance measured as a function of the area, the data are provided in the table below: C(F) A (m) 0.031 0.027 0.023 0.021 0.017 0.015 0.013 0.01 0.006 0.004 0.393 0.354 0.315 0.281 0.234 0.200 0.157 0.118 0.079 0.040 Since C = eo A plot between C and A will produce a straight line with slope Use Excel to plot C vs A, Find the slope of the line Use the slope to calculate Eo Calculate the %error Use regression analysis to find AEO Eo + slope 1) ho Write you final result sas ko+ 4 = + Data collection and analysis: I- Changing the distance between the two plate at a fixed plate's area Here is the procedure of how we normally do the experiment in the lab Place 5 of the insulating washers between the capacitor plates in a pattern as shown in figure 1. 1- Measure the capacitance between the two plates. In this case the distance between the two plates d = the average thickness of one washer ) 2- Add 5 new washers (one washer on top of each of the 5 washer we had in step 1, in this case the distance between the two plates d = 27) and measure the capacitance 3- keep adding washier until we reach a stack of 10 washers between the two plates, so the distance between the plates (d) increase from 1, 27, 37, 47,-----10t. and we measure the capacitance between the two plate at each d. Following the three steps above, the collected data (Capacitance as a function of d) is provided in the table below 1/d D (m) t 2t 3t C (UF) 0.393 0.211 0.143 0.11 0.088 0.080 0.072 0.061 0.054 0.052 101 Using the data of capacitance as a function of the distance between the plates from the table above, we ought to be able to determine &, from the slope of a graph of C vs. 1/d. Since C = o the slope of the line produced by C vs 1/d curve will be: Slope = {A Now plot C vs 1/d . Use the slope to find Calculate %error . Use regression and propagation of errors to find 4, A&o & slope DA E slope Write you final result as , 4, = II- Changing the area of the plates at a fixed d Now the distance between the two plates kept at a constant value of d=t. When the area of the plates changed and the capacitance measured as a function of the area, the data are provided in the table below: C(F) A (m) 0.031 0.027 0.023 0.021 0.017 0.015 0.013 0.01 0.006 0.004 0.393 0.354 0.315 0.281 0.234 0.200 0.157 0.118 0.079 0.040 Since C = eo A plot between C and A will produce a straight line with slope Use Excel to plot C vs A, Find the slope of the line Use the slope to calculate Eo Calculate the %error Use regression analysis to find AEO Eo + slope 1) ho Write you final result sas ko+ 4 = +


