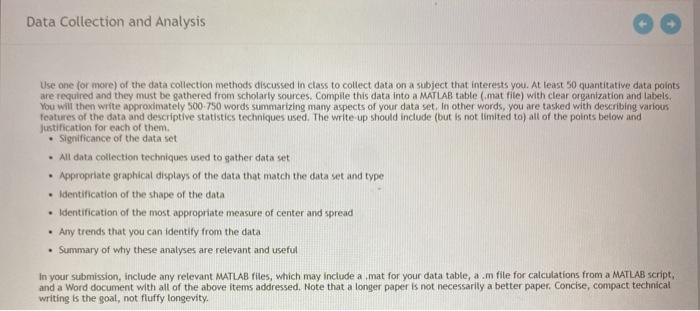
Data Collection and Analysis Use one for more) of the data collection methods discussed in class to collect data on a subject that interests you. At least 50 quantitative data points are required and they must be gathered from scholarly sources. Compile this data into a MATLAB table (.mat file) with clear organization and labels You will then write approximately 500-750 words summarizing many aspects of your data set. In other words, you are tasked with describing various features of the data and descriptive statistics techniques used. The write up should include (but is not limited to all of the points below and Justification for each of them. Significance of the data set . All data collection techniques used to gather data set Appropriate graphical displays of the data that match the data set and type Identification of the shape of the data Identification of the most appropriate measure of center and spread . Any trends that you can identify from the data Summary of why these analyses are relevant and useful . in your submission, include any relevant MATLAB files, which may include a mat for your data table, a.m file for calculations from a MATLAB script, and a Word document with all of the above items addressed. Note that a longer paper is not necessarily a better paper. Concise, compact technical writing is the goal, not fluffy longevity. Data Collection and Analysis Use one for more) of the data collection methods discussed in class to collect data on a subject that interests you. At least 50 quantitative data points are required and they must be gathered from scholarly sources. Compile this data into a MATLAB table (.mat file) with clear organization and labels You will then write approximately 500-750 words summarizing many aspects of your data set. In other words, you are tasked with describing various features of the data and descriptive statistics techniques used. The write up should include (but is not limited to all of the points below and Justification for each of them. Significance of the data set . All data collection techniques used to gather data set Appropriate graphical displays of the data that match the data set and type Identification of the shape of the data Identification of the most appropriate measure of center and spread . Any trends that you can identify from the data Summary of why these analyses are relevant and useful . in your submission, include any relevant MATLAB files, which may include a mat for your data table, a.m file for calculations from a MATLAB script, and a Word document with all of the above items addressed. Note that a longer paper is not necessarily a better paper. Concise, compact technical writing is the goal, not fluffy longevity


