

Answered step by step
Verified Expert Solution
Question
1 Approved Answer
data: course: Data mining * please do NOT send hand written solution. 9. Using the data for age given in Exercise 3.3, (a) Plot an
data:
course: Data mining
* please do NOT send hand written solution.
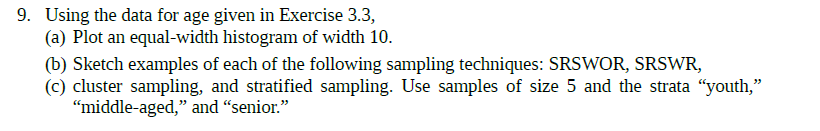
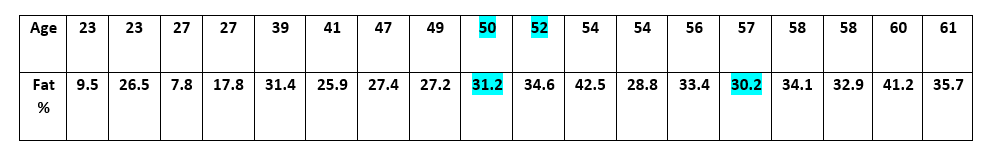
9. Using the data for age given in Exercise 3.3, (a) Plot an equal-width histogram of width 10. (b) Sketch examples of each of the following sampling techniques: SRSWOR, SRSWR, (c) cluster sampling, and stratified sampling. Use samples of size 5 and the strata youth," "middle-aged," and "senior." Age 23 23 27 27 39 41 47 49 50 52 54 54 56 57 58 58 60 61 9.5 26.5 7.8 17.8 31.4 25.9 27.4 27.2 31.2 34.6 42.5 28.8 33.4 30.2 34.1 32.9 41.2 35.7 Fat % 9. Using the data for age given in Exercise 3.3, (a) Plot an equal-width histogram of width 10. (b) Sketch examples of each of the following sampling techniques: SRSWOR, SRSWR, (c) cluster sampling, and stratified sampling. Use samples of size 5 and the strata youth," "middle-aged," and "senior." Age 23 23 27 27 39 41 47 49 50 52 54 54 56 57 58 58 60 61 9.5 26.5 7.8 17.8 31.4 25.9 27.4 27.2 31.2 34.6 42.5 28.8 33.4 30.2 34.1 32.9 41.2 35.7 Fat %Step by Step Solution
There are 3 Steps involved in it
Step: 1

Get Instant Access to Expert-Tailored Solutions
See step-by-step solutions with expert insights and AI powered tools for academic success
Step: 2

Step: 3
Ace Your Homework with AI
Get the answers you need in no time with our AI-driven, step-by-step assistance
Get Started
Database Security XI Status And Prospects
Authors: T.Y. Lin, Shelly Qian
1st Edition
0412820900, 978-0412820908