Answered step by step
Verified Expert Solution
Link Copied!

Question

1 Approved Answer

Data covering 11 years (starting with August 25, 2006 and ending with August 26, 2016) includes day-to-day returns on the S&P500. Returns are defined as
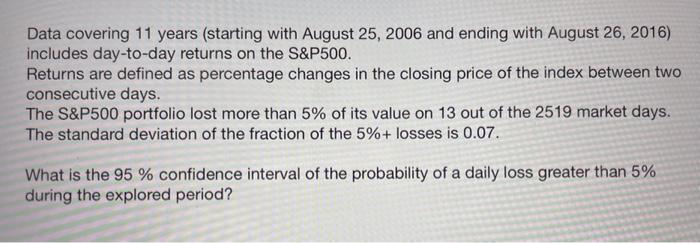
image text in transcribed
Data covering 11 years (starting with August 25, 2006 and ending with August 26, 2016) includes day-to-day returns on the S\&P500. Returns are defined as percentage changes in the closing price of the index between two consecutive days. The S\&P500 portfolio lost more than 5% of its value on 13 out of the 2519 market days. The standard deviation of the fraction of the 5%+ losses is 0.07. What is the 95% confidence interval of the probability of a daily loss greater than 5% during the explored period

Step by Step Solution

There are 3 Steps involved in it

Step: 1

blur-text-image

Get Instant Access to Expert-Tailored Solutions

See step-by-step solutions with expert insights and AI powered tools for academic success

Step: 2

blur-text-image

Step: 3

blur-text-image

Ace Your Homework with AI

Get the answers you need in no time with our AI-driven, step-by-step assistance

Get Started

Recommended Textbook for

Mastering Attribution In Finance

Authors: Andrew Colin

1st Edition

1292114029, 978-1292114026

More Books

Students also viewed these Finance questions