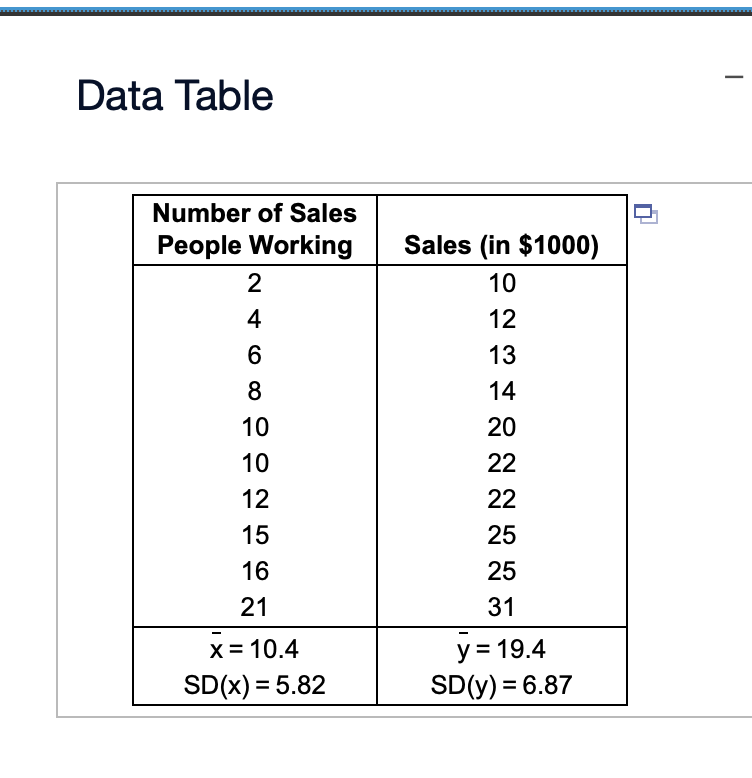
Data: Data Table Number of Sales People Working Sales (in $1000) 10 Of N 12 13 8 14 O 20 O 22 22 15 25
Data:
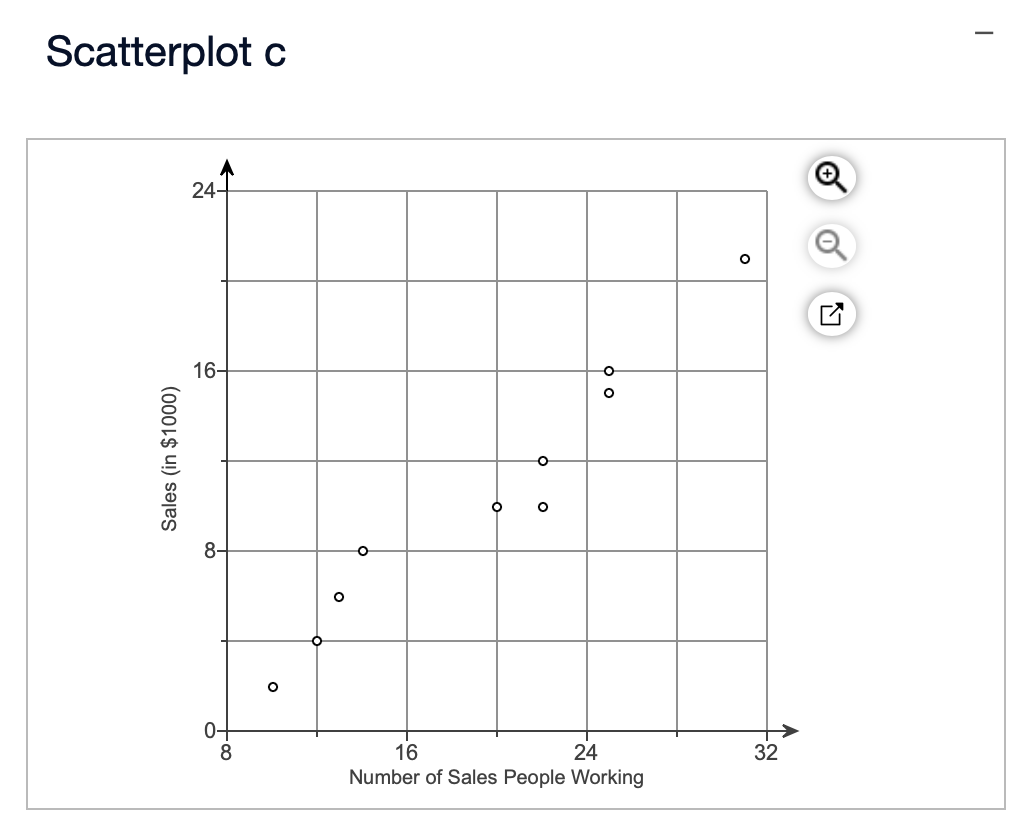
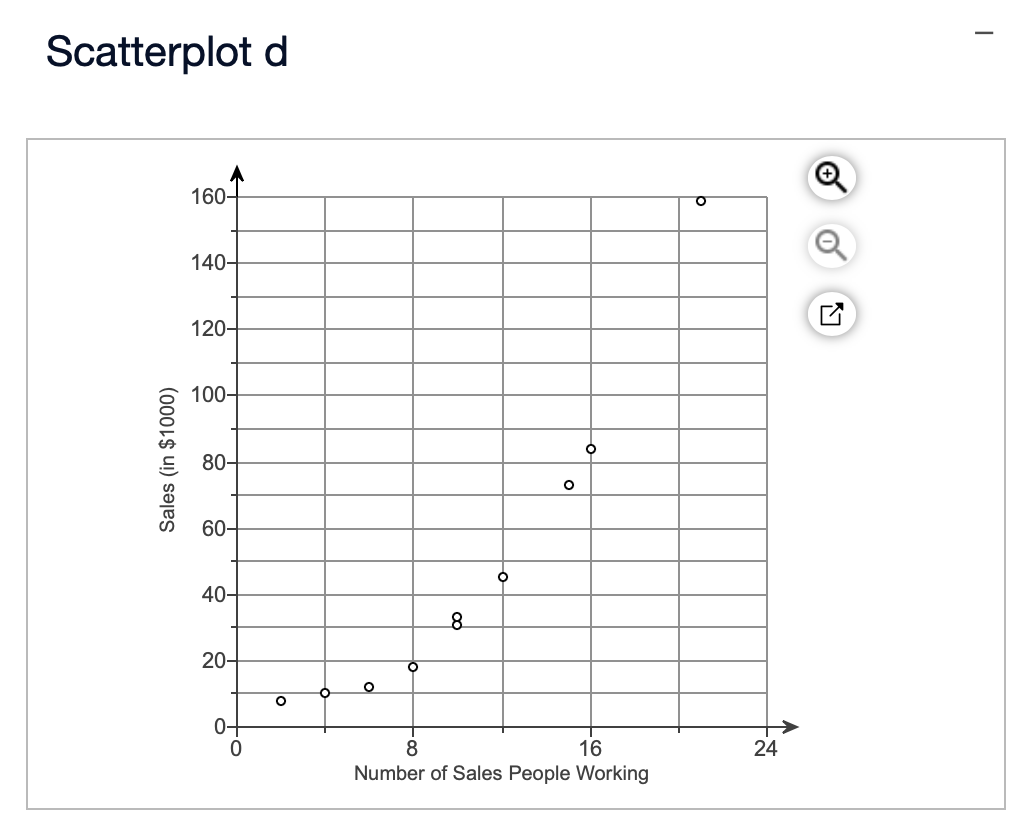
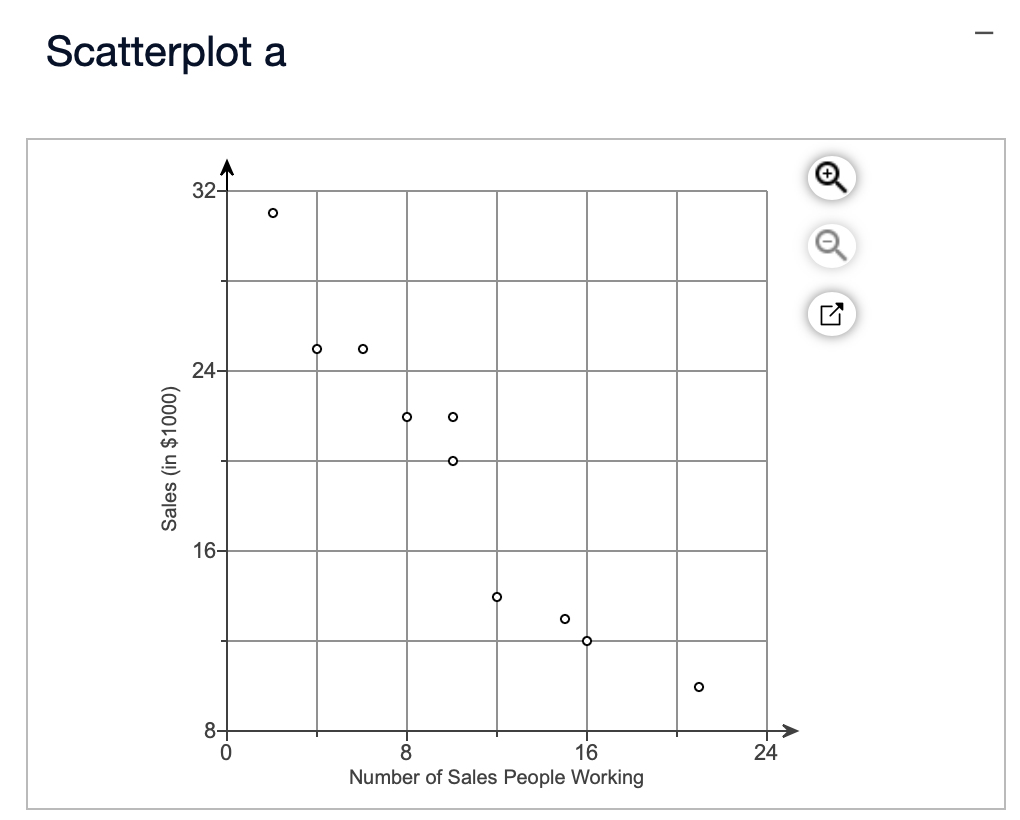
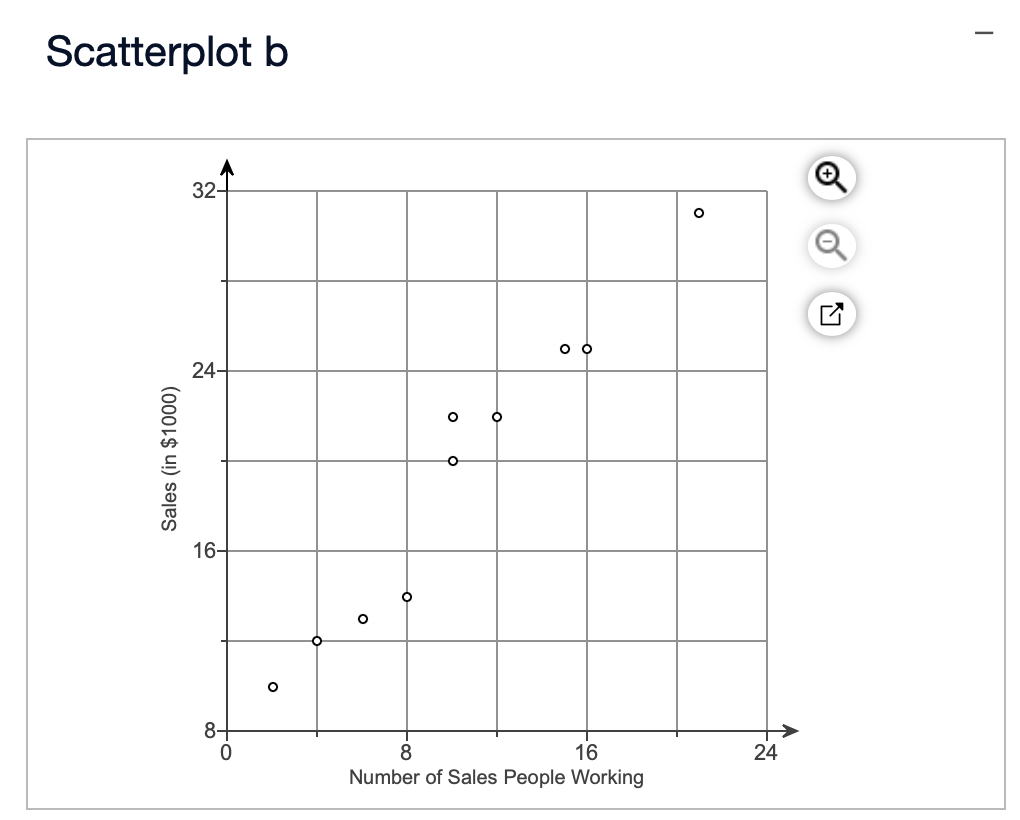
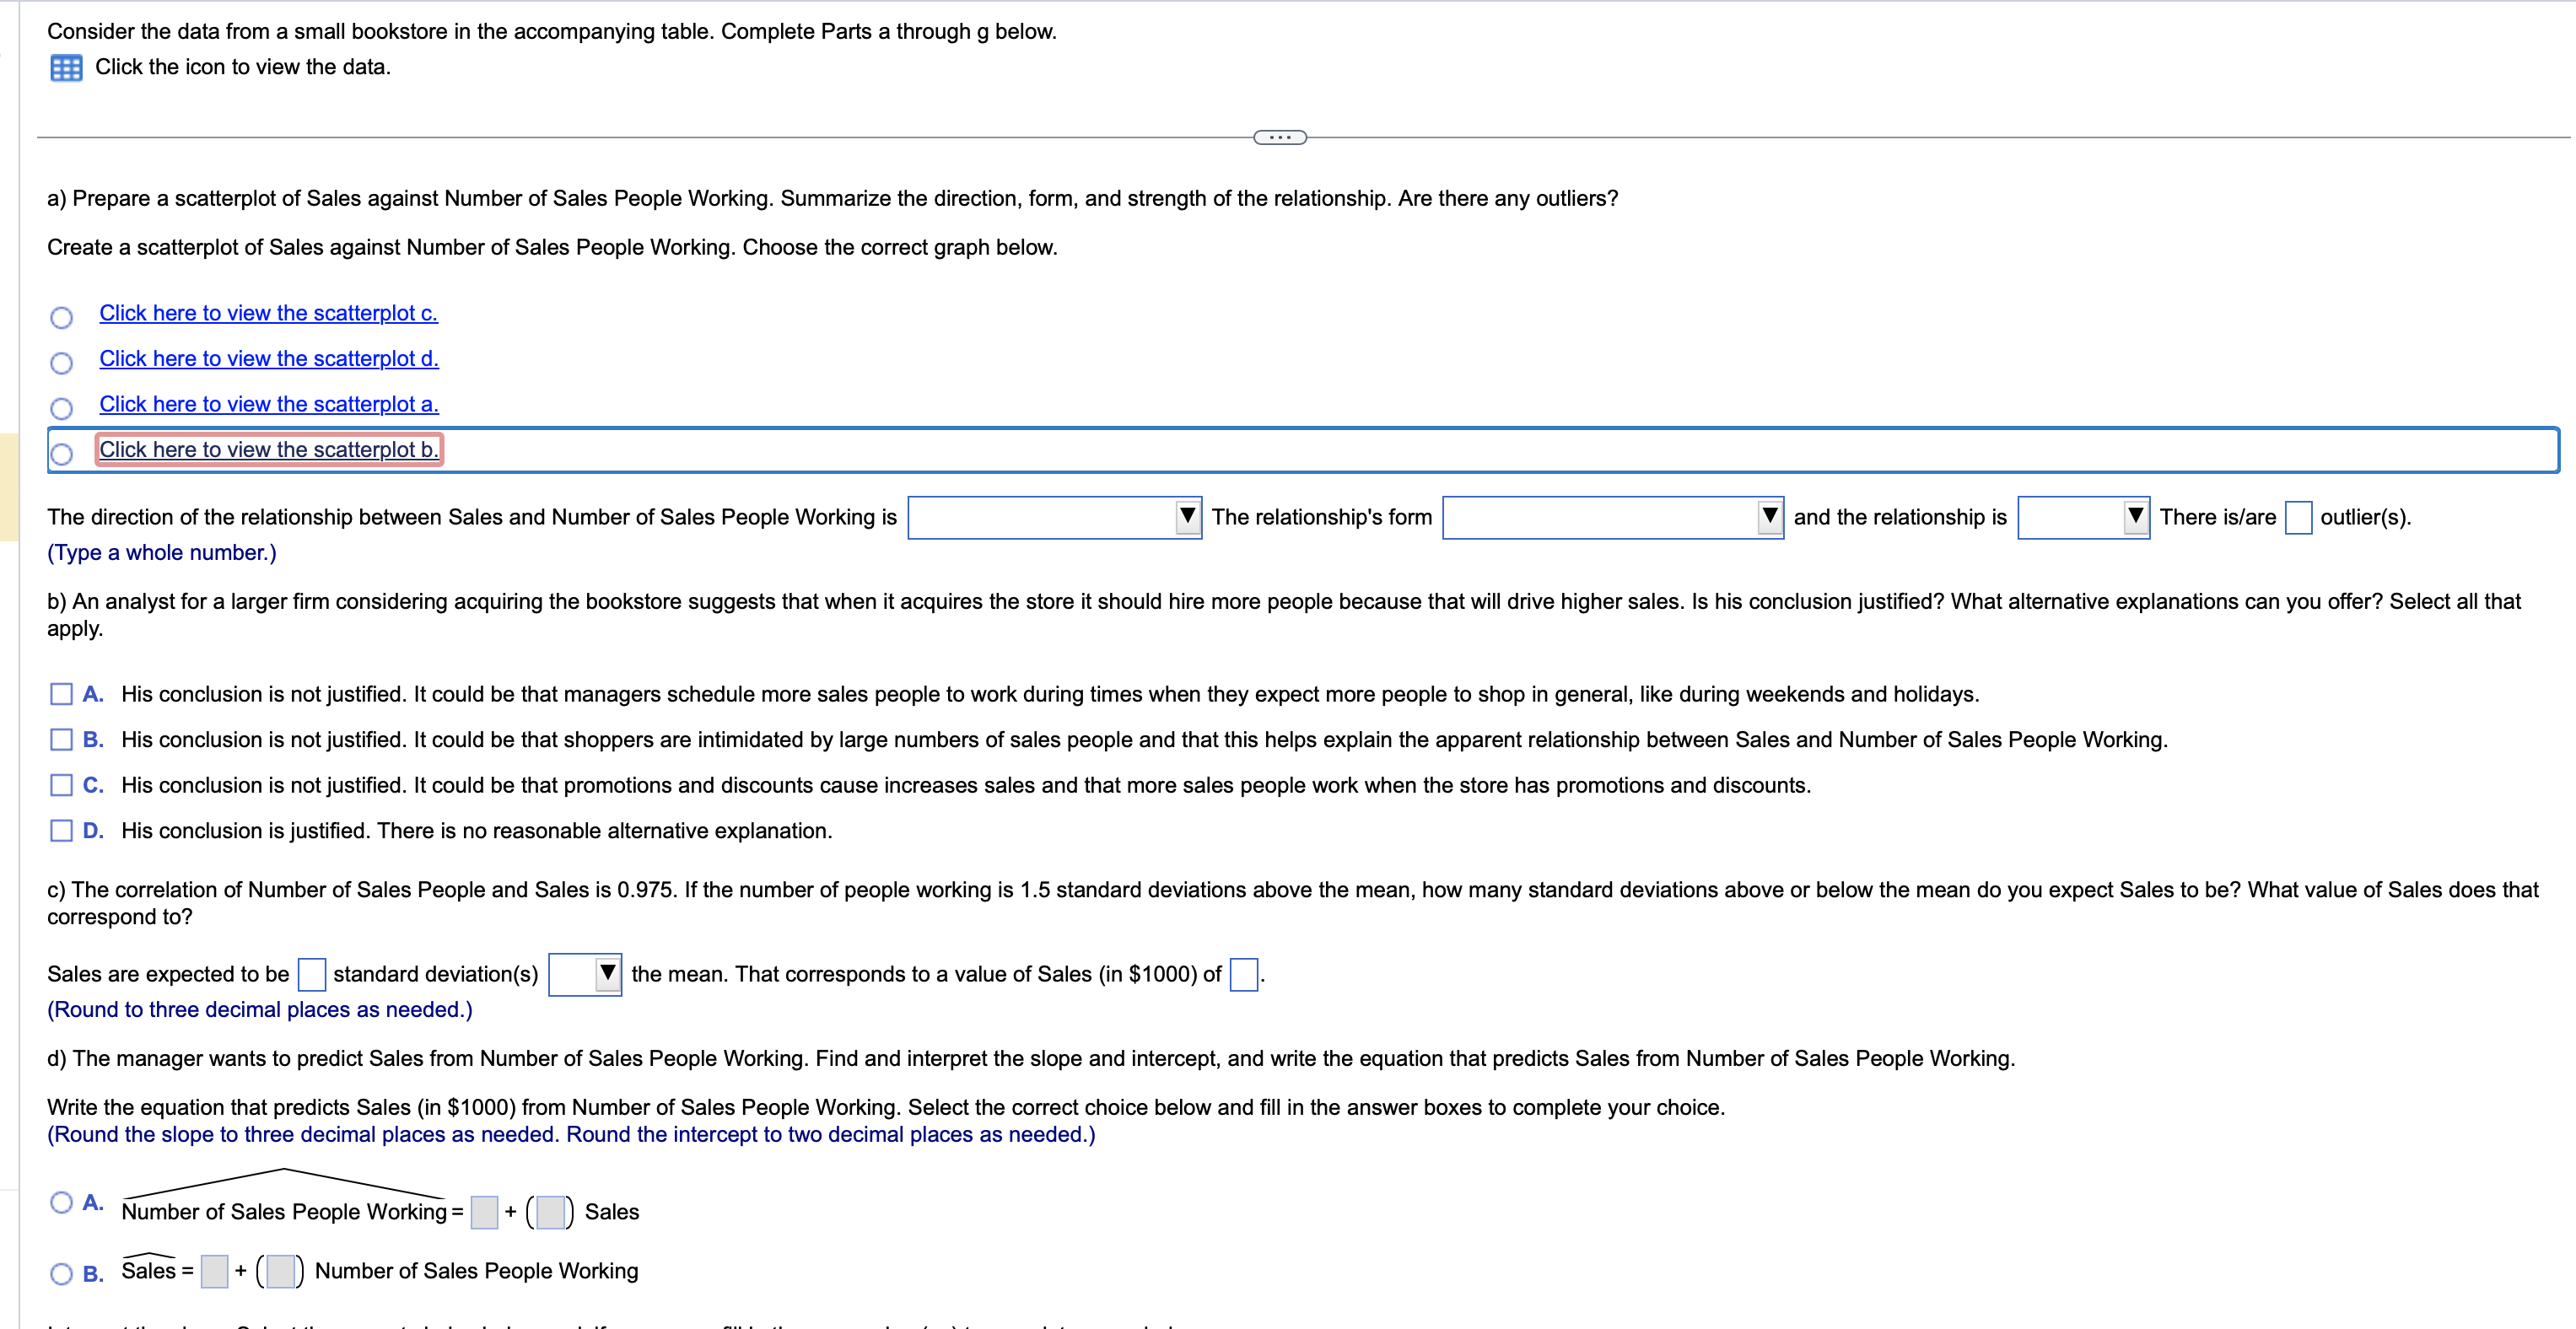
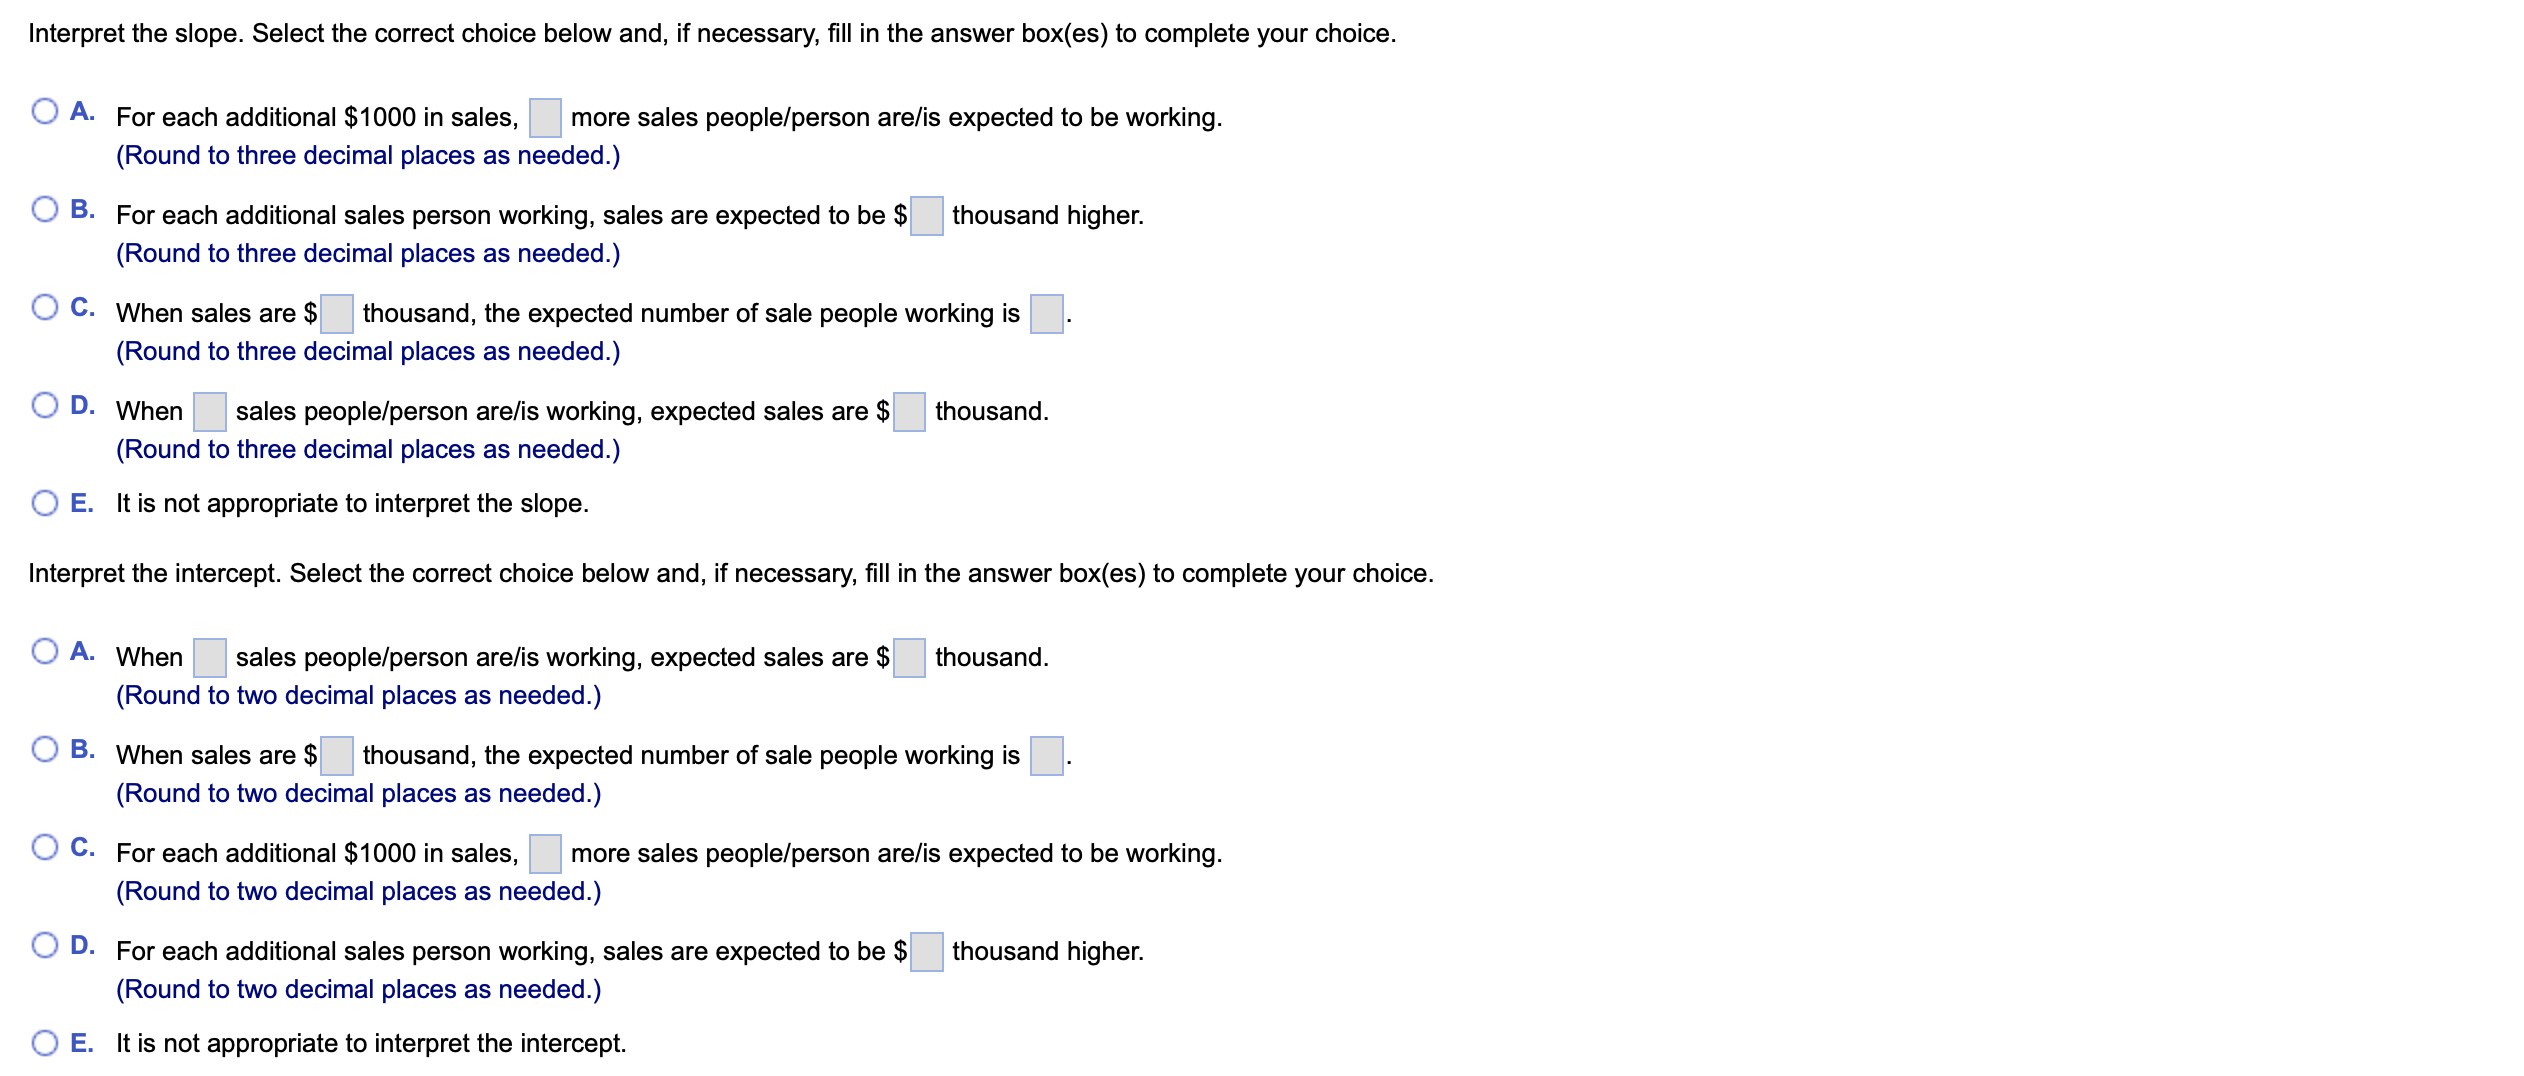
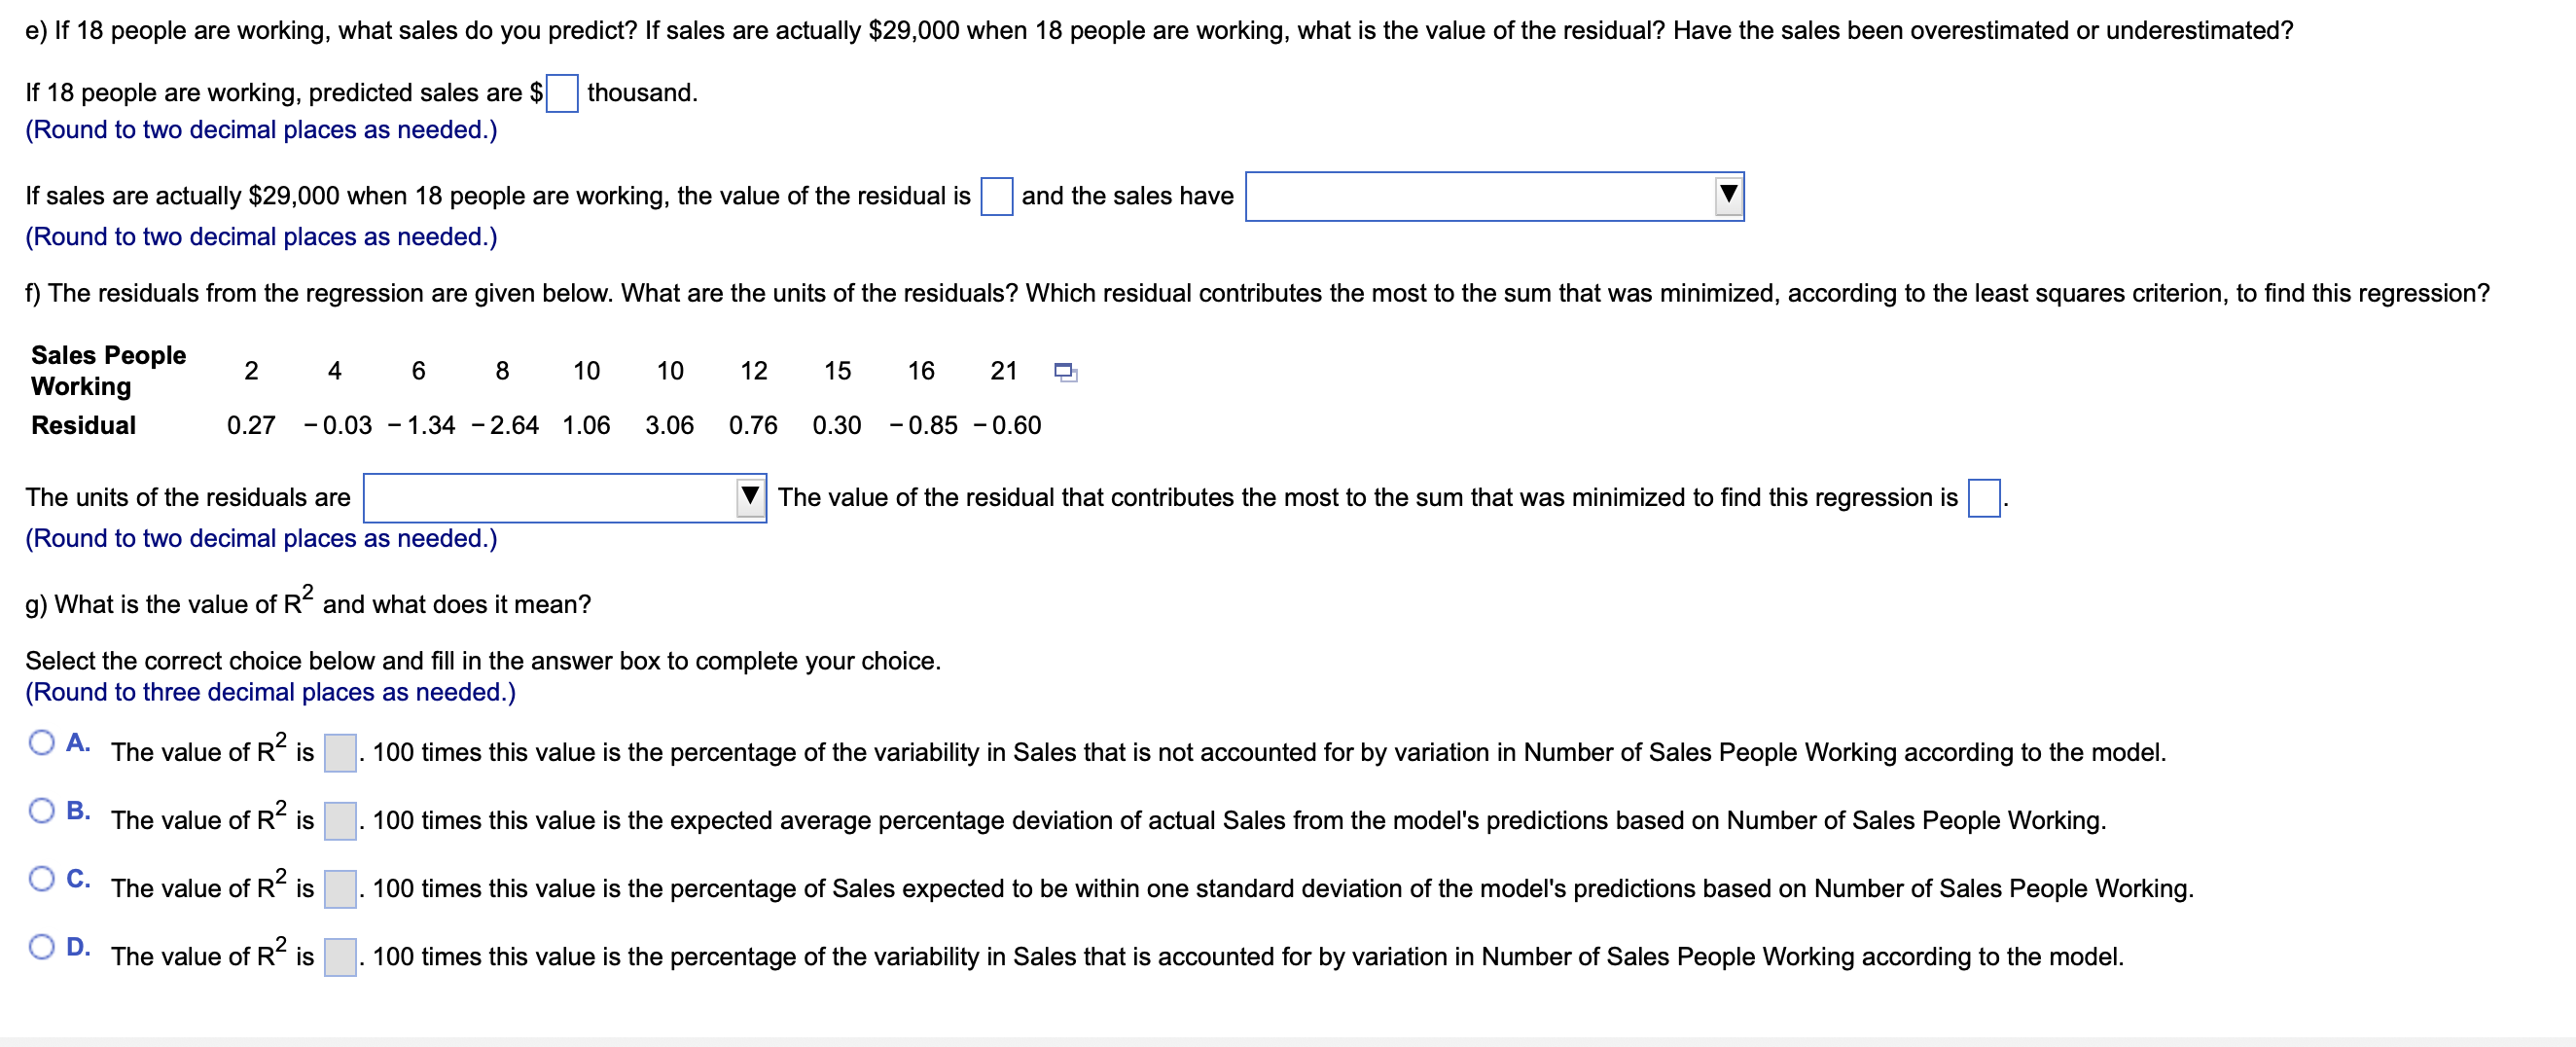
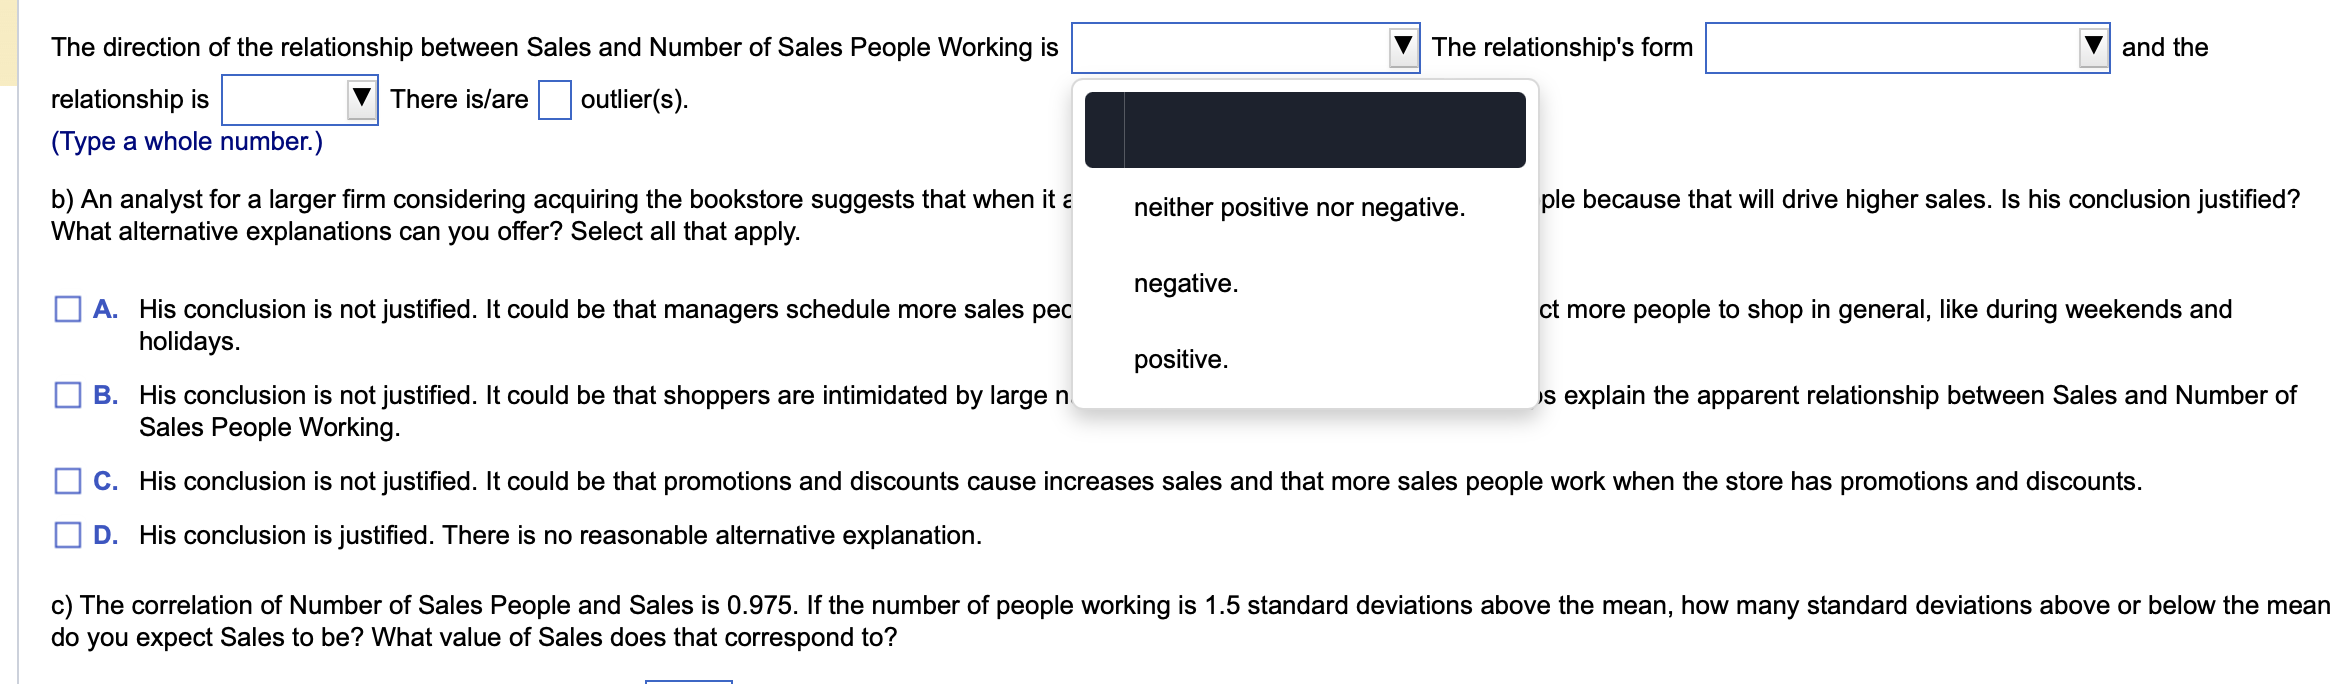
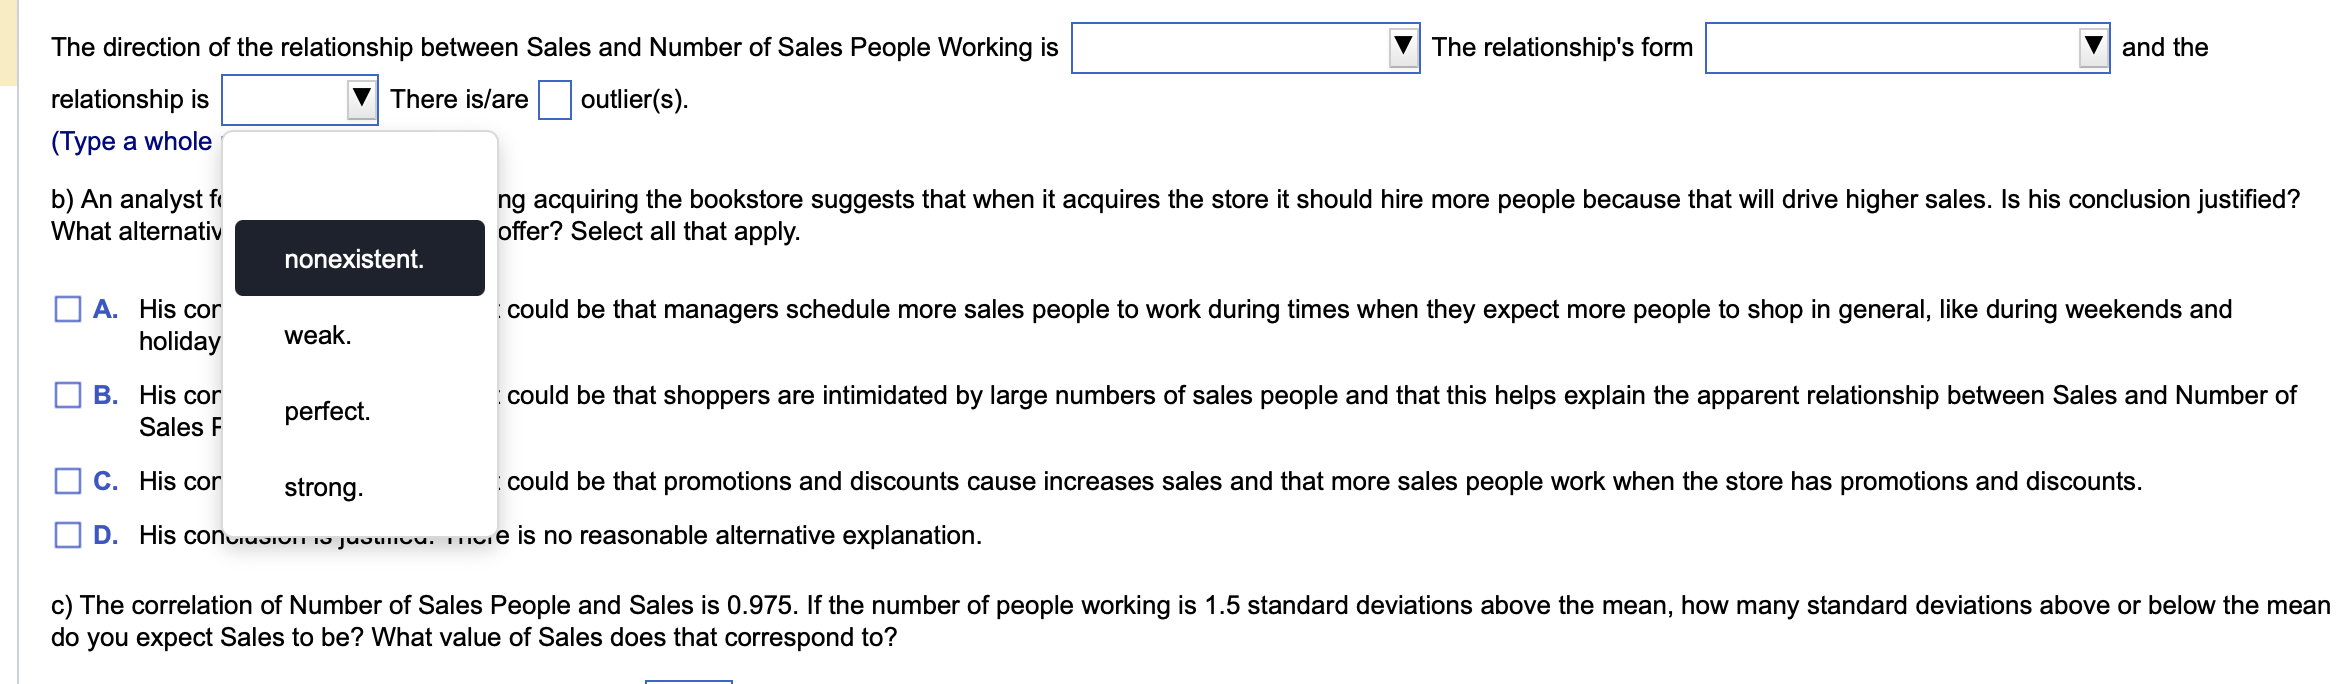
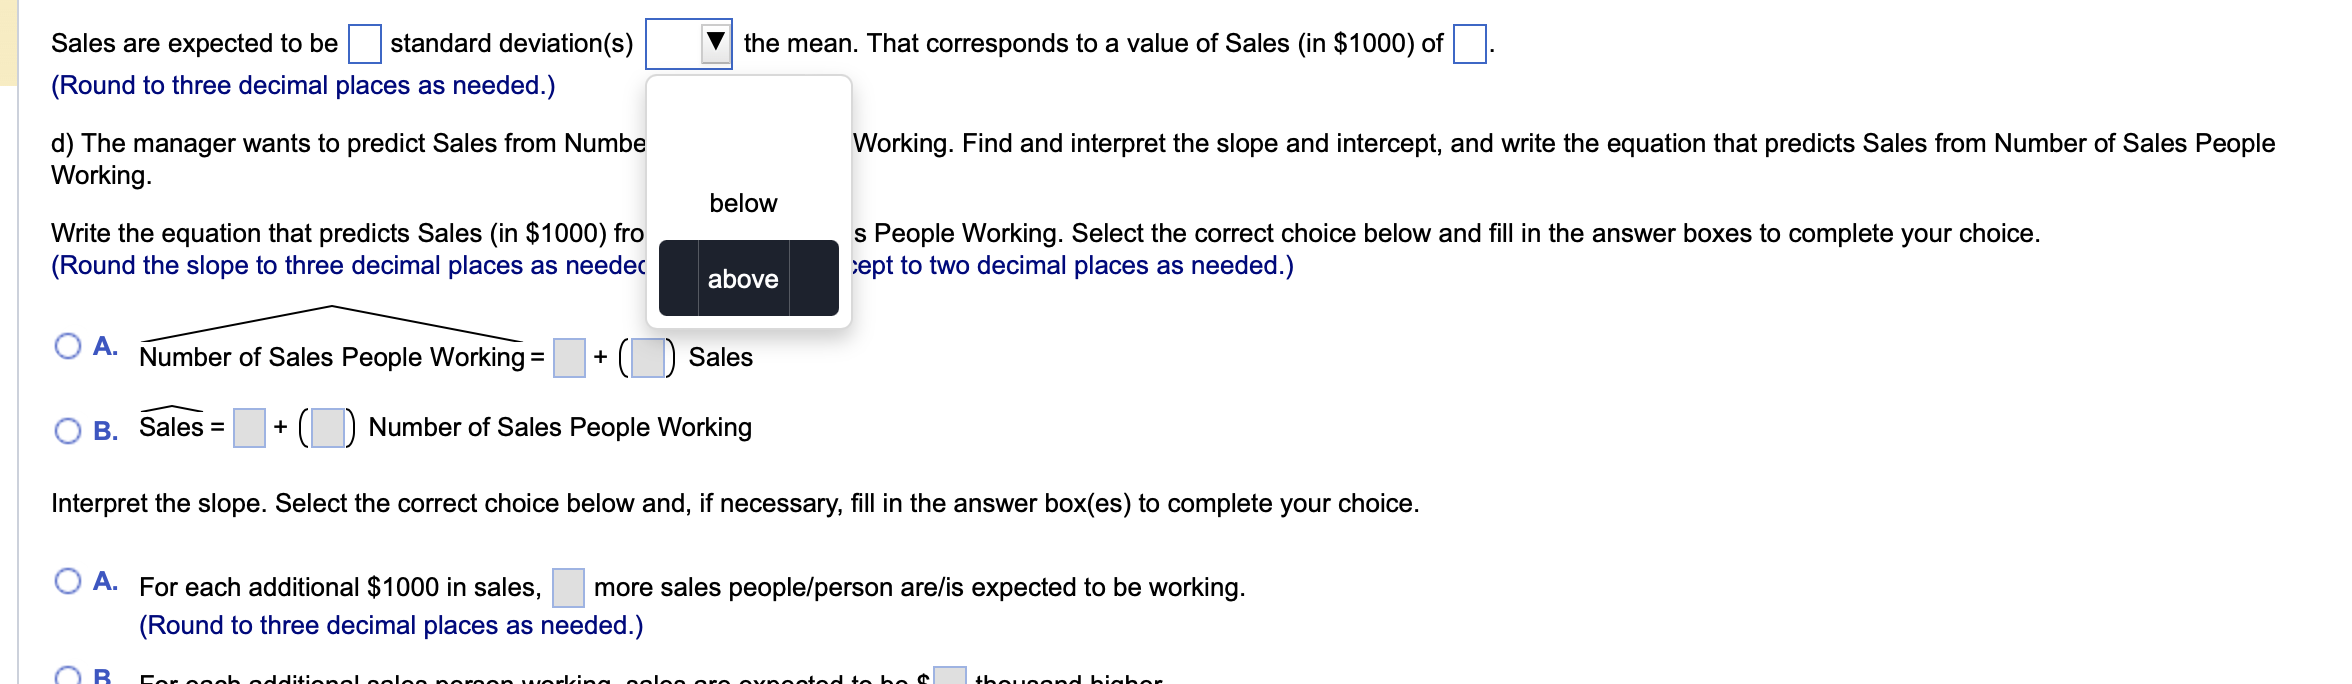
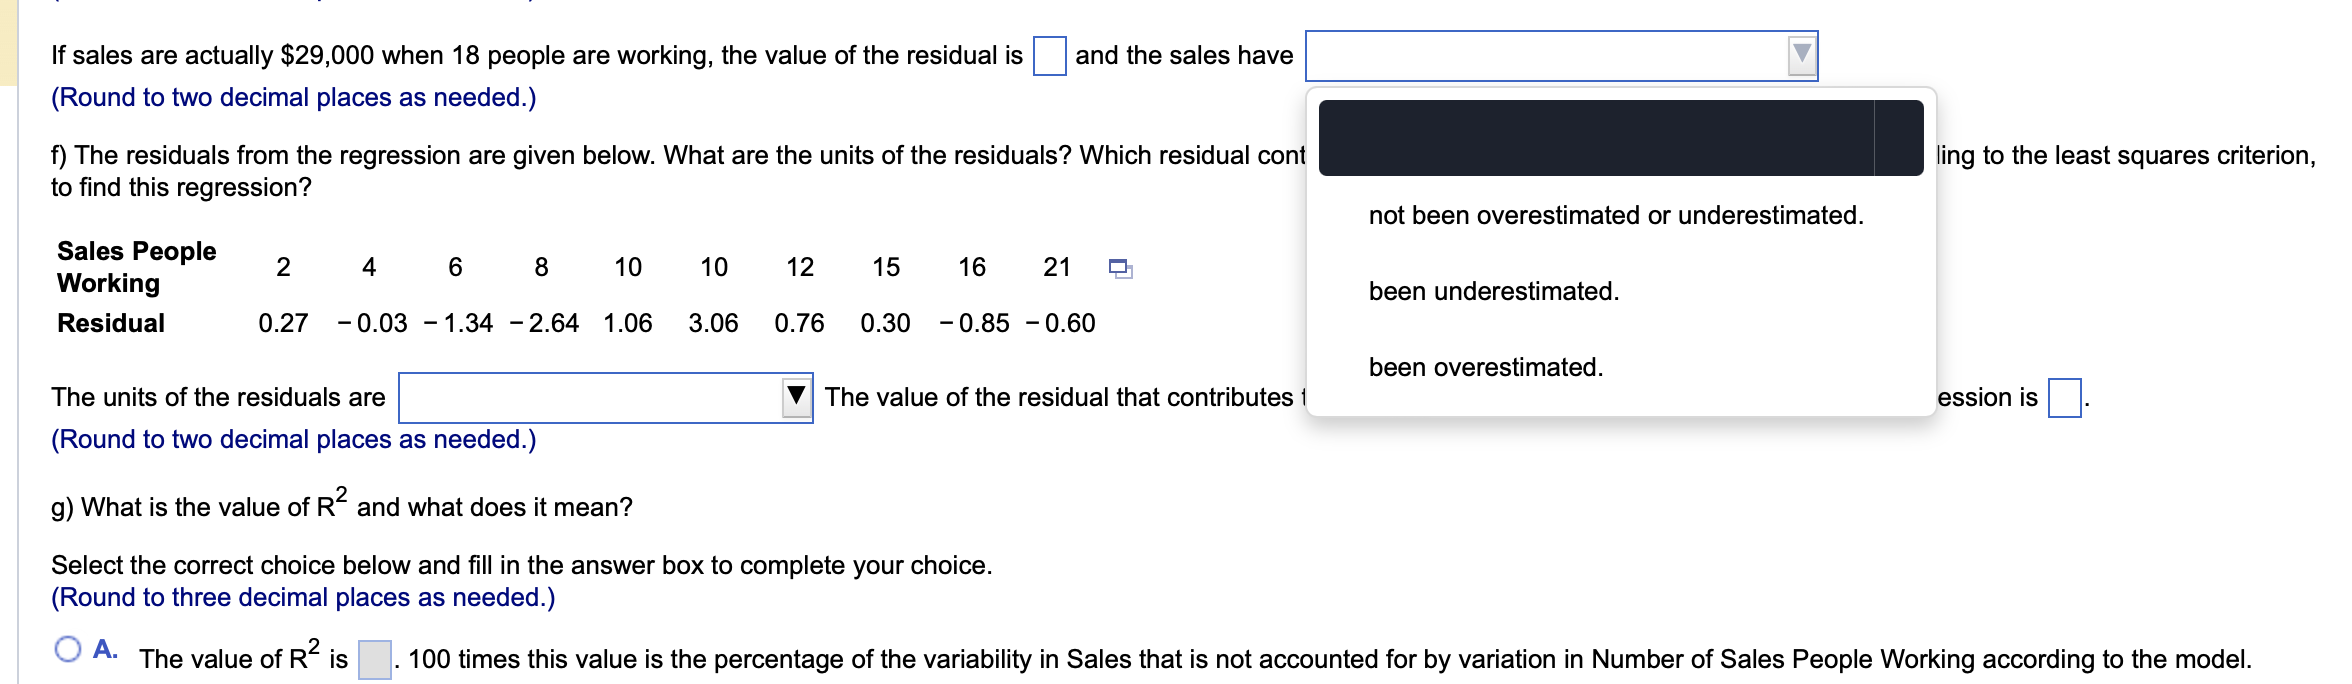
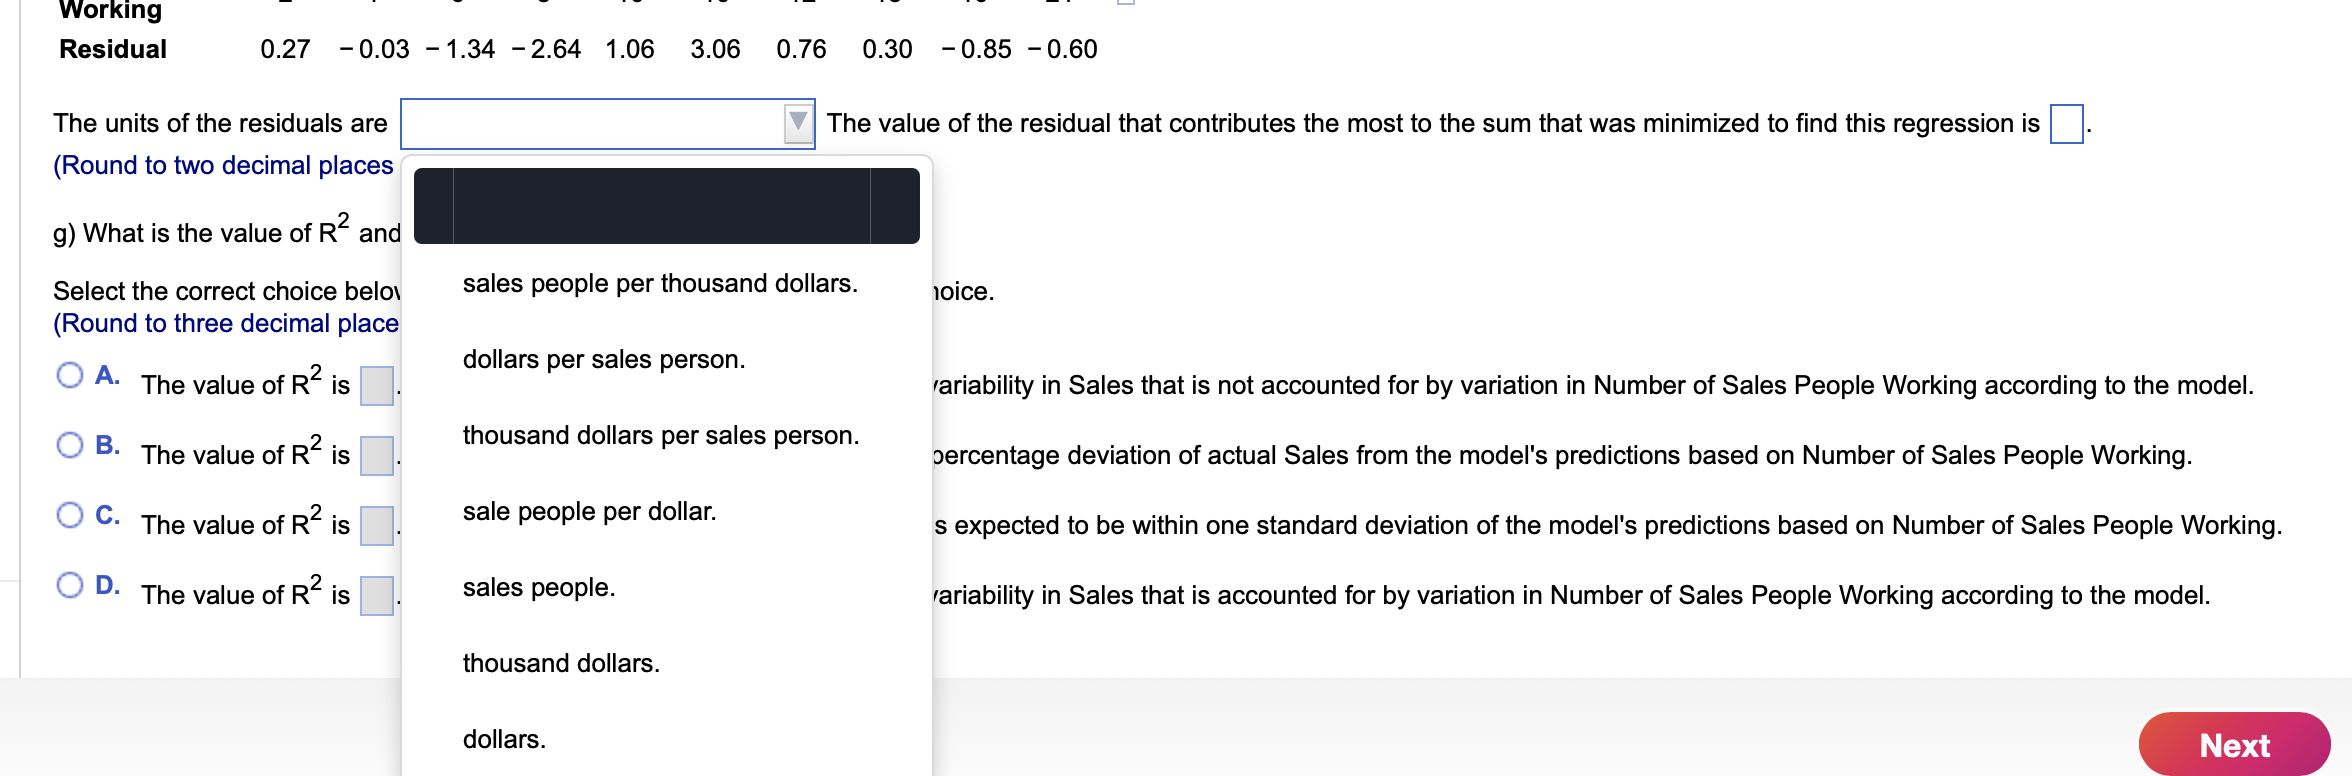
Data Table Number of Sales People Working Sales (in $1000) 10 Of N 12 13 8 14 O 20 O 22 22 15 25 16 25 21 31 X = 10.4 y = 19.4 SD(x) = 5.82 SD(y) = 6.87\f\fScatterplot a 327 + O O O 24- O O Sales (in $1000) O- 16- O O O 8- 0 16 24 Number of Sales People Working\fConsider the data from a small bookstore in the accompanying table. Complete Paris a through g below. g Click the icon to View the data. a) Prepare a scatterplot of Sales against Number of Sales People Working. Summarize the directionI form, and strength of the relationship. Are there any outliers? Create a scatterplot of Sales against Number oi Sales People Working. Choose the correct graph below. Click here to View the scatterplot c. Click here to View the scatterplot d. Click here to View the scatterplot a. The direction of the relationship between Sales and Number of Sales People Working is V The relationship's form V and the relationship is V There is/are outlier(s). (Type a whole number.) b) An analyst for a larger rm considering acquiring the bookstore suggests that when it acquires the store it should hire more people because that will drive higher sales. ls his conclusion justied? What alternative explanations can you offer? Select all that apply. His conclusion is notjustied. It could be that managers schedule more sales people to work during times when they expect more people to shop in general, like during weekends and holidays. His conclusion is not justied. It could be that shoppers are intimidated by large numbers of sales people and that this helps explain the apparent relationship between Sales and Number of Sales People Working. His conclusion is not justified. It could be that promotions and discounts cause increases sales and that more sales people work when the store has promotions and discounts. .59.\"? His conclusion is justied. There is no reasonable alternative explanation. c) The correlation of Number of Sales People and Sales is 0,975. If the number of people working is 1.5 standard deviations above the mean. how many standard deviations above or below the mean do you expect Sales to be? What value of Sales does that correspond to? Sales are expected to be standard deviation(s) V the mean. That corresponds to a value of Sales (in $1000) of (Round to three decimal places as needed.) d) The manager wants to predict Sales from Number of Sales People Working. Find and interpret the slope and intercept, and write the equation that predicts Sales from Number of Sales People Working. Write the equation that predicts Sales (in $1000) from Number of Sales People Working. Select the correct choice below and ll in the answer boxes to complete your choice. (Round the slope to three decimal places as needed. Round the intercept to two decimal places as needed.) ,. A' Number oi Sales People Working: + ( ) Sales ['7 B, Sales= + ( ) Number of Sales People Working Interpret the slope. Select the correct choice below and, if necessary, ll in the answer box(es) to complete your choice. '3:3 A- For each additional $1000 in sales, more sales people/person are/is expected to be working. (Round to three decimal places as needed.) 5- For each additional sales person working, sales are expected to be $ thousand highert (Round to three decimal places as needed.) ' C. When sales are $ thousand, the expected number of sale people working is (Round to three decimal places as needed.) 0- When sales people/person are/is working, expected sales are $ thousand. (Round to three decimal places as needed.) E. It is not appropriate to interpret the slope. Interpret the intercept. Select the correct choice below and, if necessary, ll in the answer box(es) to complete your choice. '3' A- When sales people/person are/is working, expected sales are $ thousand. (Round to two decimal places as needed.) 5- When sales are $ thousand, the expected number of sale people working is (Round to two decimal places as needed.) it" C- For each additional $1000 in sales, more sales people/person are/is expected to be working. (Round to two decimal places as needed.) '3: ' D- For each additional sales person working, sales are expected to be $ thousand higher. (Round to two decimal places as needed.) t, y E. It is not appropriate to interpret the intercept. e) If 18 people are working, what sales do you predict? If sales are actually $29,000 when 18 people are working, what is the value of the residual? Have the sales been overestimated or underestimated? If 18 people are working, predicted sales are $ thousand. (Round to two decimal places as needed.) If sales are actually $29,000 when 18 people are working, the value of the residual is and the sales have V (Round to two decimal places as needed.) f) The residuals from the regression are given below. What are the units of the residuals? Which residual contributes the most to the sum that was minimized, according to the least squares criterion, to nd this regression? sa'es.Pp' 2 4 6 8 10 1o 12 15 16 21 a Working Residual 0.27 - 0.03 -1.34 - 2.64 1.06 3.06 0.76 0.30 - 0.85 - 0.60 The units of the residuals are V The value of the residual that contributes the most to the sum that was minimized to find this regression is (Round to two decimal places as needed.) 9) What is the value of R2 and what does it mean? Select the correct choice below and ll in the answer box to complete your choice. (Round to three decimal places as needed.) C' A' The value of R2 is . 100 times this value is the percentage of the variability in Sales that is not accounted for by variation in Number of Sales People Working according to the model. C" B' The value of R2 is . 100 times this value is the expected average percentage deviation of actual Sales from the model's predictions based on Number of Sales People Working. C. The value of R2 is . 100 times this value is the percentage of Sales expected to be within one standard deviation of the model's predictions based on Number of Sales People Working. 0' The value of R2 is , 100 times this value is the percentage of the variability in Sales that is accounted for by variation in Number of Sales People Working according to the model. The direction of the relationship between Sales and Number of Sales People Working is The relationship's form and the relationship is There is/are outlier (s). (Type a whole number.) b) An analyst for a larger firm considering acquiring the bookstore suggests that when it a neither positive nor negative. ple because that will drive higher sales. Is his conclusion justified? What alternative explanations can you offer? Select all that apply. negative. A. His conclusion is not justified. It could be that managers schedule more sales pec ct more people to shop in general, like during weekends and holidays. positive. B. His conclusion is not justified. It could be that shoppers are intimidated by large n is explain the apparent relationship between Sales and Number of Sales People Working. C. His conclusion is not justified. It could be that promotions and discounts cause increases sales and that more sales people work when the store has promotions and discounts. D. His conclusion is justified. There is no reasonable alternative explanation. c) The correlation of Number of Sales People and Sales is 0.975. If the number of people working is 1.5 standard deviations above the mean, how many standard deviations above or below the mean do you expect Sales to be? What value of Sales does that correspond to?The direction of the relationship between Sales and Number of Sales People Working is V The relationship's form V and the relationship is V There is/are outlier(s). (Type a whole b) An analyst f1 ng acquiring the bookstore suggests that when it acquires the store it should hire more people because that will drive higher sales. ls his conclusion justied? What altemativ offer? Select all that apply. nonexistent. A. His cor . could be that managers schedule more sales people to work during times when they expect more people to shop in general, like during weekends and holiday weak- B. His cor perfect could be that shoppers are intimidated by large numbers of sales people and that this helps explain the apparent relationship between Sales and Number of Sales F ' 0. His cor strong. . could be that promotions and discounts cause increases sales and that more sales people work when the store has promotions and discounts D. His common\". .s,..-t...w. ...c.e is no reasonable alternative explanation. c) The correlation of Number of Sales People and Sales is 0975. If the number of people working is 1.5 standard deviations above the mean, how many standard deviations above or below the mean do you expect Sales to be? What value of Sales does that correspond to? Sales are expected to be standard deviation(s) the mean. That corresponds to a value of Sales (in $1000) of (Round to three decimal places as needed.) d) The manager wants to predict Sales from Numbe Working. Find and interpret the slope and intercept, and write the equation that predicts Sales from Number of Sales People Working. below Write the equation that predicts Sales (in $1000) fro s People Working. Select the correct choice below and fill in the answer boxes to complete your choice. (Round the slope to three decimal places as needed above cept to two decimal places as needed.) O A. Number of Sales People Working = + ( Sales O B. Sales = + () Number of Sales People Working Interpret the slope. Select the correct choice below and, if necessary, fill in the answer box(es) to complete your choice. O A. For each additional $1000 in sales, more sales people/person are/is expected to be working. (Round to three decimal places as needed.)If sales are actually $29,000 when 18 people are working, the value of the residual is and the sales have (Round to two decimal places as needed.) f) The residuals from the regression are given below. What are the units of the residuals? Which residual cont ling to the least squares criterion, to nd this regression? not been overestimated or underestimated. sa'es.PP' 2 4 6 8 10 1o 12 15 16 21 1:: Working been underestimated. Residual 0.27 -0.03 -1.34 -2.64 1.06 3.06 0.76 0.30 -0.85 -0.60 been overestimated. The units of the residuals are V The value of the residual that contributes 1 ession is (Round to two decimal places as needed.) 9) What is the value of R2 and what does it mean? Select the correct choice below and ll in the answer box to complete your choice. (Round to three decimal places as needed.) '33 A' The value of R2 is . 100 times this value is the percentage of the variability in Sales that is not accounted for by variation in Number of Sales People Working according to the model. Working Residual 0.27 0.03 1.34 2.64 1.06 3.06 0.76 0.30 0.85 0.60 The units of the residuals are The value of the residual that contributes the most to the sum that was minimized to find this regression is (Round to two decimal places 9) What is the value of R2 and _ Select the correct choice belm sales people per thousand dollars. Ioice. (Round to three decimal place A 2 dollars per sales person. ' The value of R is . variability in Sales that is not accounted for by variation in Number of Sales People Working according to the model. {3 B. thousand dollars per sales person. , The value of R2 is aercentage deviation of actual Sales from the model's predictions based on Number of Sales People Working. {a c. The value of R2 is sale people per dollar. 5 expected to be within one standard deviation of the model's predictions based on Number of Sales People Working. {:3 D' The value of R2 is . sales people. variability in Sales that is accounted for by variation in Number of Sales People Working according to the model. thousand dollars
Step by Step Solution
There are 3 Steps involved in it
Step: 1
Get Instant Access to Expert-Tailored Solutions
See step-by-step solutions with expert insights and AI powered tools for academic success
Step: 2
Step: 3
Ace Your Homework with AI
Get the answers you need in no time with our AI-driven, step-by-step assistance