

Question
Data: Date IBM CSCO S&P* Apr 24, 2018 169.78 28.82 2,717.69 Apr 23, 2018 170.24 28.68 2,712.93 Apr 22, 2018 165.36 28.62 2,707.96 Apr 21,
Data:
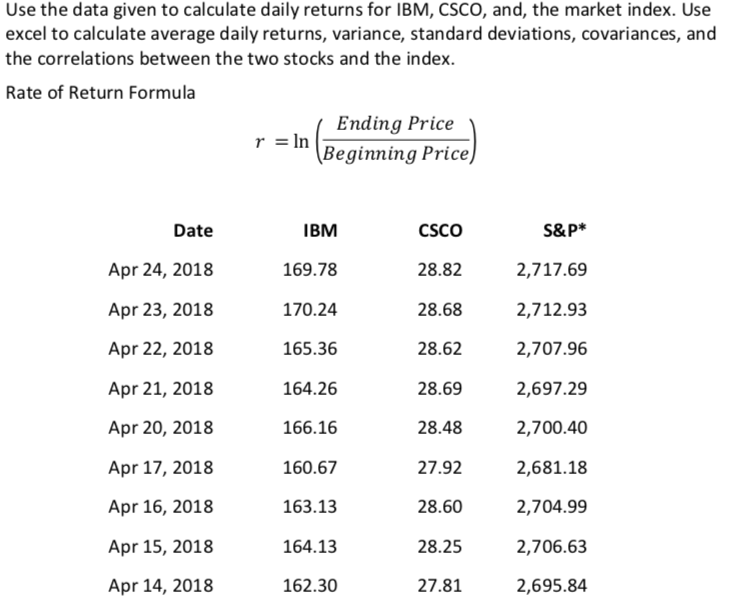
| Date | IBM | CSCO | S&P* |
| Apr 24, 2018 | 169.78 | 28.82 | 2,717.69 |
| Apr 23, 2018 | 170.24 | 28.68 | 2,712.93 |
| Apr 22, 2018 | 165.36 | 28.62 | 2,707.96 |
| Apr 21, 2018 | 164.26 | 28.69 | 2,697.29 |
| Apr 20, 2018 | 166.16 | 28.48 | 2,700.40 |
| Apr 17, 2018 | 160.67 | 27.92 | 2,681.18 |
| Apr 16, 2018 | 163.13 | 28.60 | 2,704.99 |
| Apr 15, 2018 | 164.13 | 28.25 | 2,706.63 |
| Apr 14, 2018 | 162.30 | 27.81 | 2,695.84 |
Q: 2) Assuming equal weight between each pair of stocks, compute the mean daily return and the standard deviation of each of the three portfolios. (please provide also the formula (microsoft excel's))
3)Create a risk return scatter plot and enter the average daily return (vertical axis) and standard deviation (horizontal axis) for the three individual stocks and the three portfolios.Briefly discuss the results based on the material in this chapter.
Use the data given to calculate daily returns for IBM, CSCO, and, the market index. Use excel to calculate average daily returns, variance, standard deviations, covariances, and the correlations between the two stocks and the index. Rate of Return Formula Ending Price r = In Beginning Price) Date IBM CSCO S&P* Apr 24, 2018 169.78 28.82 2,717.69 Apr 23, 2018 170.24 28.68 2,712.93 Apr 22, 2018 165.36 28.62 2,707.96 Apr 21, 2018 164.26 28.69 2,697.29 Apr 20, 2018 166.16 28.48 2,700.40 Apr 17, 2018 160.67 27.92 2,681.18 Apr 16, 2018 163.13 28.60 2,704.99 Apr 15, 2018 164.13 28.25 2,706.63 Apr 14, 2018 162.30 27.81 2,695.84 Use the data given to calculate daily returns for IBM, CSCO, and, the market index. Use excel to calculate average daily returns, variance, standard deviations, covariances, and the correlations between the two stocks and the index. Rate of Return Formula Ending Price r = In Beginning Price) Date IBM CSCO S&P* Apr 24, 2018 169.78 28.82 2,717.69 Apr 23, 2018 170.24 28.68 2,712.93 Apr 22, 2018 165.36 28.62 2,707.96 Apr 21, 2018 164.26 28.69 2,697.29 Apr 20, 2018 166.16 28.48 2,700.40 Apr 17, 2018 160.67 27.92 2,681.18 Apr 16, 2018 163.13 28.60 2,704.99 Apr 15, 2018 164.13 28.25 2,706.63 Apr 14, 2018 162.30 27.81 2,695.84Step by Step Solution
There are 3 Steps involved in it
Step: 1

Get Instant Access to Expert-Tailored Solutions
See step-by-step solutions with expert insights and AI powered tools for academic success
Step: 2

Step: 3
Ace Your Homework with AI
Get the answers you need in no time with our AI-driven, step-by-step assistance
Get Started
Accounting And Auditing Standards For Islamic Financial Institutions
Authors: Mohd MaSum Billah
1st Edition
103206353X, 978-1032063539