Answered step by step
Verified Expert Solution
Question
1 Approved Answer
# Data for a plague epidemic in Bombay, October 1905-September 1906 # # @article{1908, # title={XXXI. On the seasonal prevalence of plague in India.}, #
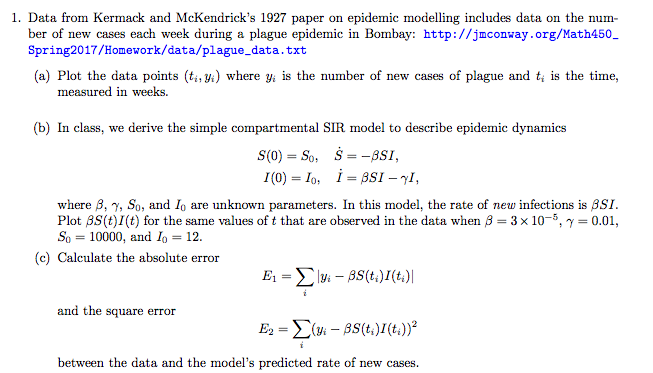
# Data for a plague epidemic in Bombay, October 1905-September 1906 # # @article{1908, # title={XXXI. On the seasonal prevalence of plague in India.}, # author={}, # journal={The Journal of hygiene}, # year={1908}, # month={May}, # volume={8}, # issue={2}, # pages={266-301}, # annote={}, # PMCID={PMC2167146}, # } # @article{1908, # title={XXXII. On the differential diagnosis of the plague bacillus from certain allied organisms.}, # author={}, # journal={The Journal of hygiene}, # year={1908}, # month={May}, # volume={8}, # issue={2}, # pages={302-308.55}, # annote={}, # PMCID={PMC2167147}, # } # @article{1907, # title={XXII. Epidemiological observations in Bombay City.}, # author={}, # journal={The Journal of hygiene}, # year={1907}, # month={Dec}, # volume={7}, # issue={6}, # pages={724-98}, # annote={}, # PMCID={PMC2236259}, # } # @article{1912, # title={XLIX. Statistics of the occurrence of plague in man and rats in Bombay, 1907-11.}, # author={}, # journal={The Journal of hygiene}, # year={1912}, # month={Dec}, # volume={12}, # issue={Suppl}, # pages={221-6}, # annote={}, # PMCID={PMC2167442}, # } # # # 1st column = week of data point (52 week year) # 2nd column = number of plague deaths # 00,12 01,16 02,24 03,48 04,51 05,92 06,124 07,178 08,280 09,387 10,442 11,644 12,779 13,702 14,695 15,870 16,925 17,802 18,578 19,404 20,296 21,162 22,106 23,64 24,46 25,35 26,27 27,28 28,24 29,26 30,29 31,17 32,31 33,15 34,14 35,18 36,22 37,22 38,30 39,31 40,18 41,12 42,9 43,13 44,6 45,9 46,5 47,9 48,16 49,8 50,8 51,10 1. Data from Kermack and McKendrick's 1927 paper on epidemic modelling includes data on the num- ber of new cases each week during a plague epidemic in Bombay: http://jmconway.org/Math450 Spring 2017/Homework/data/plague-data. txt (a) Plot the data points (ti, yi) where yi is the number of new cases of plague and ti is the time, measured in weeks. (b) In class, we derive the simple compartmental SIR model to describe epidemic dynamics S(0) BSI. I BSI I where B, n, So, and lo are unknown parameters. In this model, the rate of new infections is BSI Plot BS(t)I(t) for the same values of t that are observed in the data when B 3 x 10 0.01 So 10000, and Io 12. (c) Calculate the absolute error and the square error between the data and the model's predicted rate of new cases 1. Data from Kermack and McKendrick's 1927 paper on epidemic modelling includes data on the num- ber of new cases each week during a plague epidemic in Bombay: http://jmconway.org/Math450 Spring 2017/Homework/data/plague-data. txt (a) Plot the data points (ti, yi) where yi is the number of new cases of plague and ti is the time, measured in weeks. (b) In class, we derive the simple compartmental SIR model to describe epidemic dynamics S(0) BSI. I BSI I where B, n, So, and lo are unknown parameters. In this model, the rate of new infections is BSI Plot BS(t)I(t) for the same values of t that are observed in the data when B 3 x 10 0.01 So 10000, and Io 12. (c) Calculate the absolute error and the square error between the data and the model's predicted rate of new cases Step by Step Solution
There are 3 Steps involved in it
Step: 1

Get Instant Access to Expert-Tailored Solutions
See step-by-step solutions with expert insights and AI powered tools for academic success
Step: 2

Step: 3
Ace Your Homework with AI
Get the answers you need in no time with our AI-driven, step-by-step assistance
Get Started