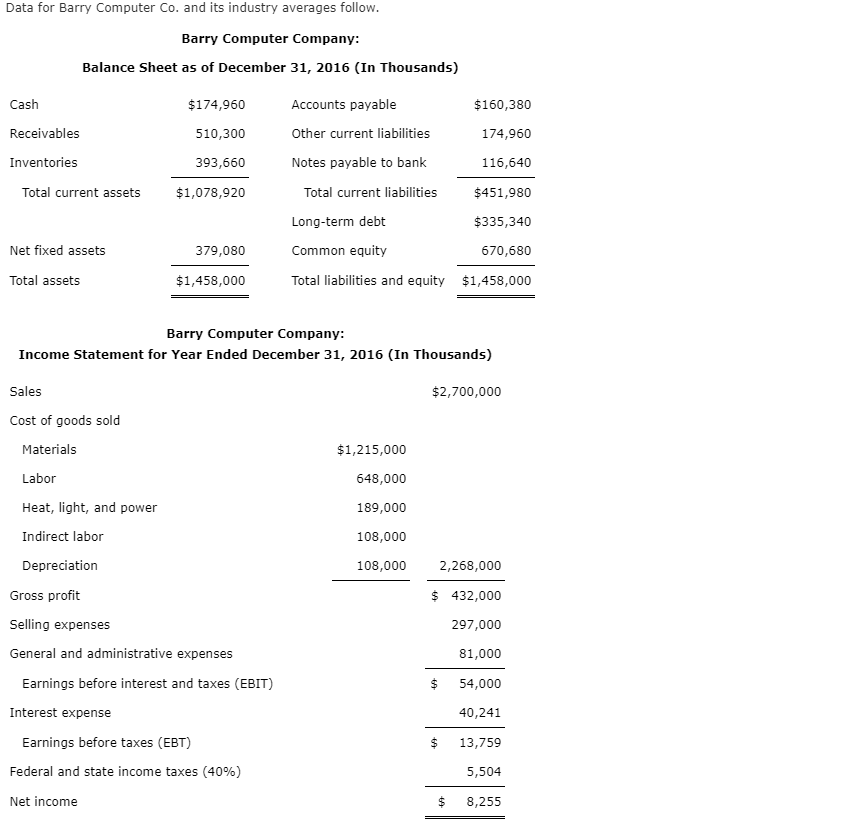
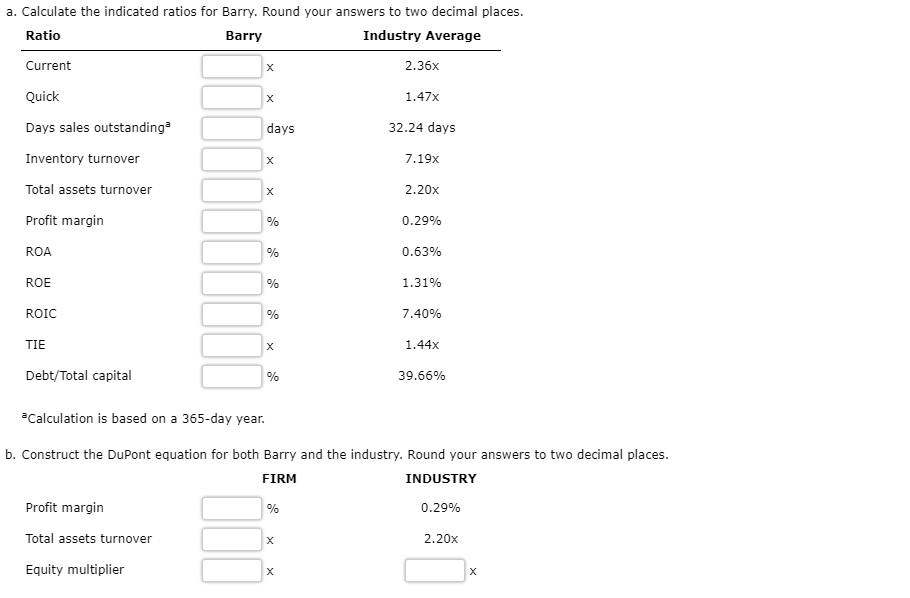
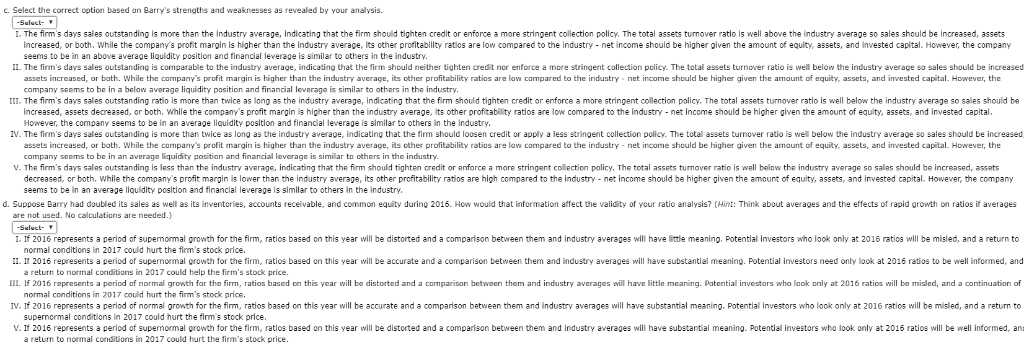
Data for Barry Computer Co. and its industry averages follow Barry Computer Company: Balance Sheet as of December 31, 2016 (In Thousands) Accounts payable Cash $174,960 $160,380 Receivables Other current liabilities 174,960 510,300 Inventories 393,660 Notes payable to bank 116,640 Total current assets $1,078,920 Total current liabilities $451,980 Long-term debt $335,340 Net fixed assets 379,080 Common equity 670,680 Total assets $1,458,000 Total liabilities and equity $1,458,000 Barry Computer Company: Income Statement for Year Ended December 31, 2016 (In Thousands) Sales $2,700,000 Cost of goods sold Materials $1,215,000 Labor 648,000 Heat, light, and power 189,000 Indirect labor 108,000 Depreciation 108,000 2,268,000 Gross profit $432,000 Selling expenses 297,000 General and administrative expenses 81,000 Earnings before interest and taxes (EBIT) $54,000 40,241 Interest expense Earnings before taxes (EBT) $13,759 Federal and state income taxes (40%) 5,504 Net income $8,255 a. Calculate the indicated ratios for Barry. Round your answers to two decimal places. Ratio Barry Industry Average Current 2.36x Quick 1.47x Days sales outstanding 32.24 days days 7.19x Inventory turnover Total assets turnover 2.20x Profit margin 0.29% ROA 0.63% ROE 1.31% 7.40% ROIC TIE 1.44x Debt/Total capital 39.66% Calculation is based on a 365-day year b. Construct the DuPont equation for both Barry and the industry. Round your answers to two decimal places INDUSTRY FIRM Profit margin 0.29% Total assets turnover 2.20x Equity multiplier C. Select the correct option based on Barry's strengths and weaknesses as revealed by your analysis The firm's days sales outstanding is more than the industry average, indicating that the firm should tighten credit or enforce a more stringent collection policy. The total assets turnover ratio is well above the industry average so sales should be increased, assets increased, or both, While the company's profit margin is higher than the industry average, its other profitability ratios are low compared to the Industry net income should be higher given the amount of equity, assets, and invested capital. However, the company seems to be in an above average liquidity position and financial leverage is similar to others in the industry I The firm's days sales outstanding is comparable to the industry average, indicating that the firm should neither tighten credit nor enforce a more stringent collection policy. The total assets turnover ratio is well below the industry average so sales should be increased assets increased, or bath. While the company's profit margin is higher than the industry average, its other profitability ratios are low compared to the industry-net income should be higher given the amaunt of equity,assets, and invested capital. However, the company seems to be in a below average liquidity position and financial leverage is similar to others in the industry. . The firm's days sales outstanding ratio is more than twice as long as the industry average, indicating that the firm should tighten credit or enforce a more stringent collection policy. The total assets turnover ratio is well below the industry average so sales should be Increased, assets decreased, or both, While the company's profit margin is higher than the industry average, its other profitability ratlos are low compared to the Industry - net income should be higher given the amount of equity, assets, and Invested capital. However, the company seems to be in an average liquidity position and financial leverage is similar to others in the industry IV. The firm's days sales outstanding is more than twice as long as the industry average, indicating that the firm should loosen credit or apply a less stringent collection policy. The total assets turnover ratio is wel below the industry average so sales should be increased assets increased, or bath. While the companiy's profit margin is higher than the industry average, its other profitability ratios are low compared to the industry-net income should be higher given the amount of equity, assets, and invested capital. However, the company seems to be in an average liquidity position and financial leverage is similar to others in the industry V. The firm's days sales outstanding is less than the industry average, indicating that the firm should tighten credit or enforce a more stringent collection policy. The total assets turnover ratio is well below the industry average so sales should be increased, assets decreased, or both, while the company's profit margin is lower than the industry average, its other profitability ratios are high compared to the industry - net income should be higher given the amount of equity, assets, and invested capital. However, the company seems to be in an average liquldity position and financial leverage is similar to others in the Industry d. Suppose Barry had doubled its sales as well as its inventories, accounts receivable, and common equity during 2016. How would that information affect the validity of your ratio analysis? (Hint: Think about averages and the effects of rapid growth on ratios if averages are not used. No calculations are needed.) 1. If 2016 represents a period of supemormal growth for the firm, ratlos based on this year will be distorted and a comparison between them and Industry averages will have little meaning. Potential investors who look only at 2016 ratios will be misled, and a return to normal conditions in 2017 could hurt the firm's stock price II 2016 represents a period of supemormal growth for the firm, ratios based on this year will be accurate and a comparison between them and industry averages will have substantial meaning. Potential investors need only look at 2016 ratios to be well informed, and a return to normal conditions in 2017 could help the firm's stock price. III. If 2016 represents a period of normal growth for the firm, ratios based on this year will be distorted and a comparison between them and industry averages will have little meaning. Patential investors who look only at 2016 ratios will be misled, and a continuation of normal conditions in 2017 could hurt the firm's stock price. IV. If 2016 represents a period of normal growth for the firm, ratios based on this year will be accurate and a comparison between them and industry averages will have substantial meaning. Potential investors who look only at 2016 ratios will be misled, and a return to supernormal conditions in 2017 could hurt the firm's stock price. V 2016 epresents a period of supemo mal growth or the firm, ratios based on this year will be distorted and a comparison between them and industry averages ill have substantial meaning Potential investors ho look on y at 2016 ratios will be el informed an a return to normal conditions in 2017 could hurt the firm's stock price