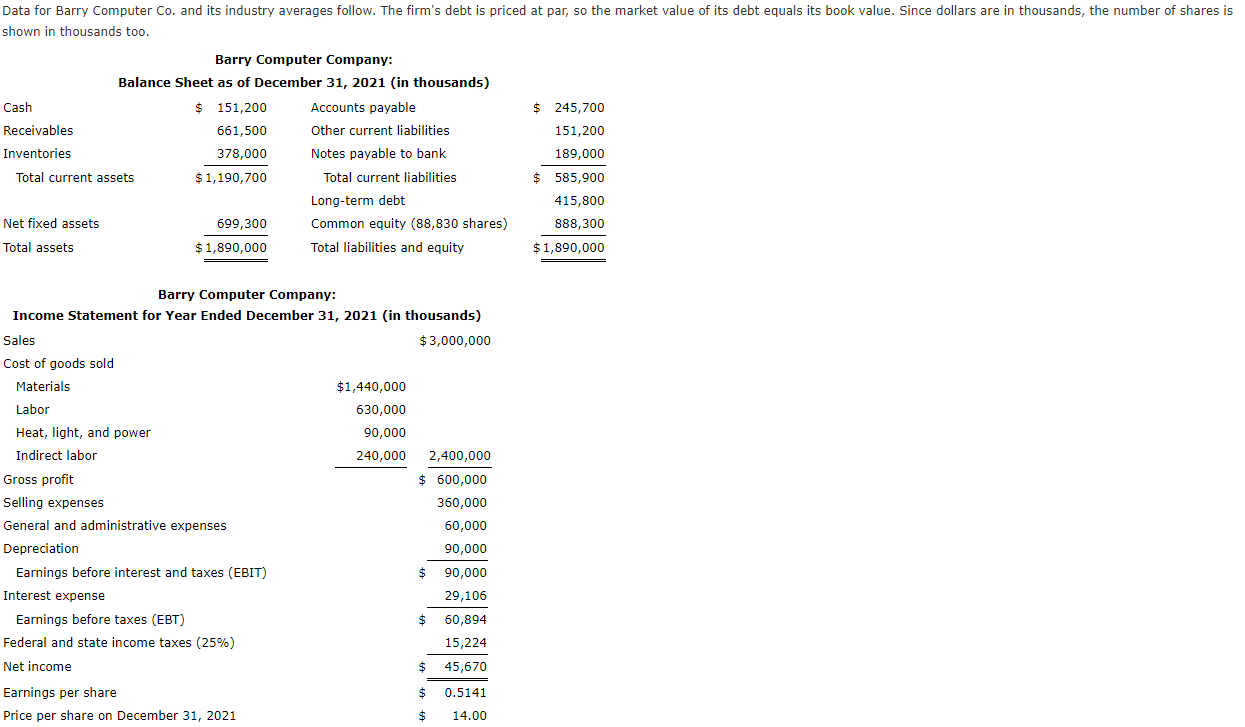
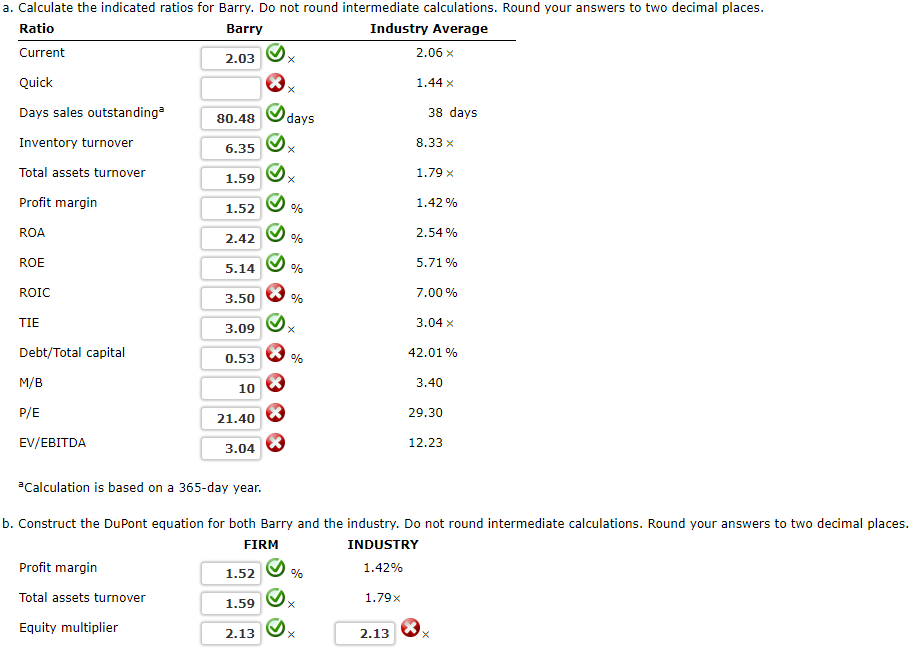
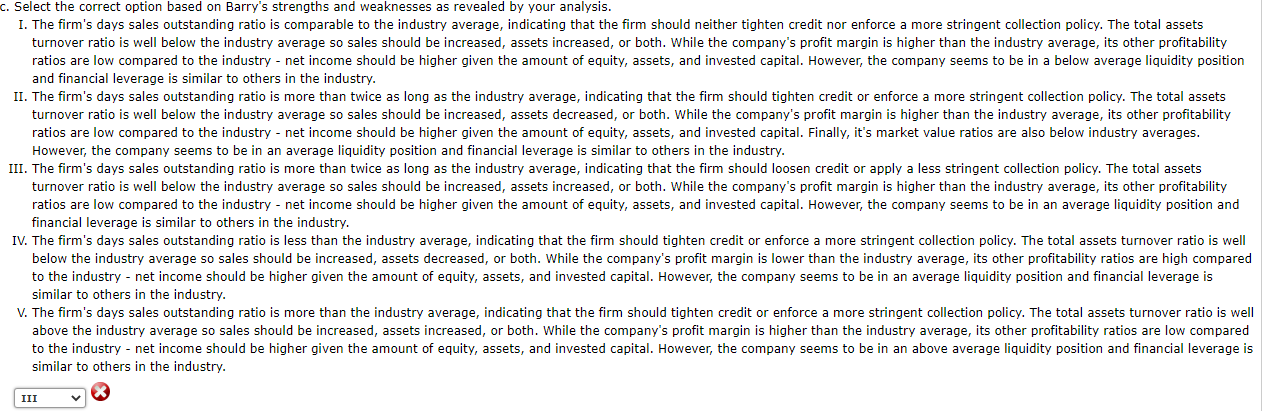
Data for Barry Computer Co. and its industry averages follow. The firm's debt is priced at par, so the market value of its debt equals its book value. Since dollars are in thousands, the number of shares is shown in thousands too. Barry Computer Company: Balance Sheet as of December 31, 2021 (in thousands) Cash $ 151,200 Accounts payable Receivables 661,500 Other current liabilities Inventories 378,000 Notes payable to bank Total current assets $ 1,190,700 Total current liabilities Long-term debt Net fixed assets 699,300 Common equity (88,830 shares) Total assets $ 1,890,000 Total liabilities and equity $ 245,700 151,200 189,000 585,900 415,800 888.300 $ 1,890,000 Barry Computer Company: Income Statement for Year Ended December 31, 2021 (in thousands) Sales $3,000,000 Cost of goods sold Materials $1,440,000 Labor 630,000 Heat, light, and power 90,000 Indirect labor 240,000 2,400,000 Gross profit $ 600,000 Selling expenses 360,000 General and administrative expenses 60,000 Depreciation 90,000 Earnings before interest and taxes (EBIT) $ 90,000 Interest expense 29,106 Earnings before taxes (EBT) $ 60,894 Federal and state income taxes (25%) 15,224 Net income $ 45,670 Earnings per share $ 0.5141 Price per share on December 31, 2021 $ 14.00 a. Calculate the indicated ratios for Barry. Do not round intermediate calculations. Round your answers to two decimal places. Ratio Barry Industry Average Current 2.03 2.06 Quick 1.44 x Days sales outstandinga 80.48 days 38 days Inventory turnover 6.35 8.33 x Total assets turnover 1.59 1.79 x x Profit margin 1.42 % 1.52 % ROA 2.42 % 2.54% ROE 5.71 % 5.14 % ROIC 3.50 % 7.00% TIE 3.04 x 3.09 Debt/Total capital % 42.01 % M/B 0.53 10 3.40 P/E 21.40 29.30 EV/EBITDA 12.23 3.04 Calculation is based on a 365-day year. b. Construct the DuPont equation for both Barry and the industry. Do not round intermediate calculations. Round your answers to two decimal places. FIRM INDUSTRY Profit margin 1.52 % 1.42% Total assets turnover 1.79% 1.59 Equity multiplier 2.13 2.13 C. Select the correct option based on Barry's strengths and weaknesses as revealed by your analysis. I. The firm's days sales outstanding ratio is comparable to the industry average, indicating that the firm should neither tighten credit nor enforce a more stringent collection policy. The total assets turnover ratio is well below the industry average so sales should be increased, assets increased, or both. While the company's profit margin is higher than the industry average, its other profitability ratios are low compared to the industry - net income should be higher given the amount of equity, assets, and invested capital. However, the company seems to be in a below average liquidity position and financial leverage is similar to others in the industry. II. The firm's days sales outstanding ratio is more than twice as long as the industry average, indicating that the firm should tighten credit or enforce a more stringent collection policy. The total assets turnover ratio is well below the industry average so sales should be increased, assets decreased, or both. While the company's profit margin is higher than the industry average, its other profitability ratios are low compared to the industry - net income should be higher given the amount of equity, assets, and invested capital. Finally, it's market value ratios are also below industry averages. However, the company seems to be in an average liquidity position and financial leverage is similar to others in the industry. III. The firm's days sales outstanding ratio is more than twice as long as the industry average, indicating that the firm should loosen credit or apply a less stringent collection policy. The total assets turnover ratio is well below the industry average so sales should be increased, assets increased, or both. While the company's profit margin is higher than the industry average, its other profitability ratios are low compared to the industry - net income should be higher given the amount of equity, assets, and invested capital. However, the company seems to be in an average liquidity position and financial leverage is similar to others in the industry. IV. The firm's days sales outstanding ratio is less than the industry average, indicating that the firm should tighten credit or enforce a more stringent collection policy. The total assets turnover ratio is well below the industry average so sales should be increased, assets decreased, or both. While the company's profit margin is lower than the industry average, its other profitability ratios are high compared to the industry - net income should be higher given the amount of equity, assets, and invested capital. However, the company seems to be in an average liquidity position and financial leverage is similar to others in the industry. V. The firm's days sales outstanding ratio is more than the industry average, indicating that the firm should tighten credit or enforce a more stringent collection policy. The total assets turnover ratio is well above the industry average so sales should be increased, assets increased, or both. While the company's profit margin is higher than the industry average, its other profitability ratios are low compared to the industry - net income should be higher given the amount of equity, assets, and invested capital. However, the company seems to be in an above average liquidity position and financial leverage is similar to others in the industry