

Answered step by step
Verified Expert Solution
Question
1 Approved Answer
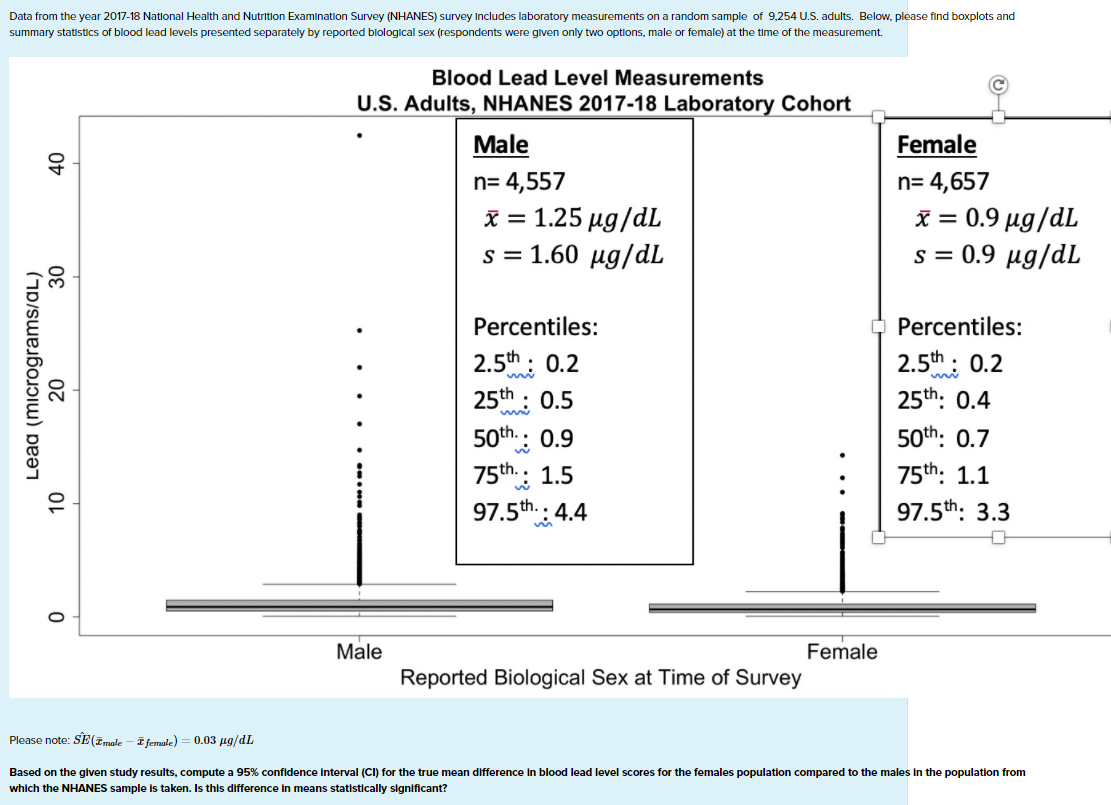
Data from the year 2017-18 National Health and Nutrition Examination Survey (NHANES) survey Includes laboratory measurements on a random sample of 9,254 U.S. adults. Below,
Step by Step Solution
There are 3 Steps involved in it
Step: 1

Get Instant Access to Expert-Tailored Solutions
See step-by-step solutions with expert insights and AI powered tools for academic success
Step: 2

Step: 3
Ace Your Homework with AI
Get the answers you need in no time with our AI-driven, step-by-step assistance
Get Started
Calculus Early Transcendentals, Multivariable
Authors: Michael Sullivan, Kathleen Miranda
2nd Edition
131924288X, 9781319242886