

Answered step by step
Verified Expert Solution
Question
1 Approved Answer
data is on spreadsheet A sales manager collected data on annual sales for new customer accounts and the number of years of experience for a
data is on spreadsheet
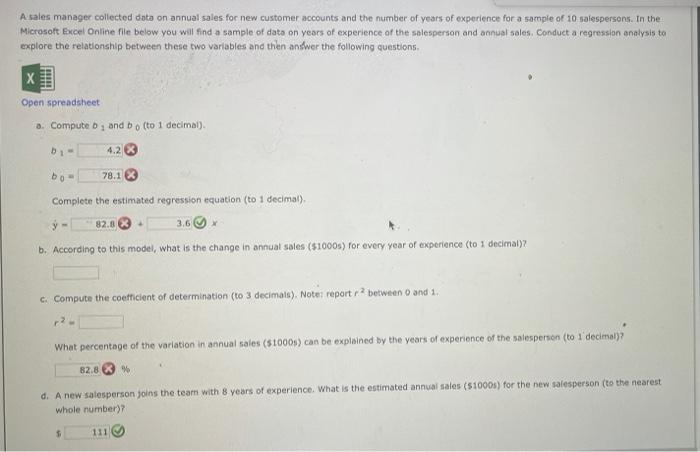
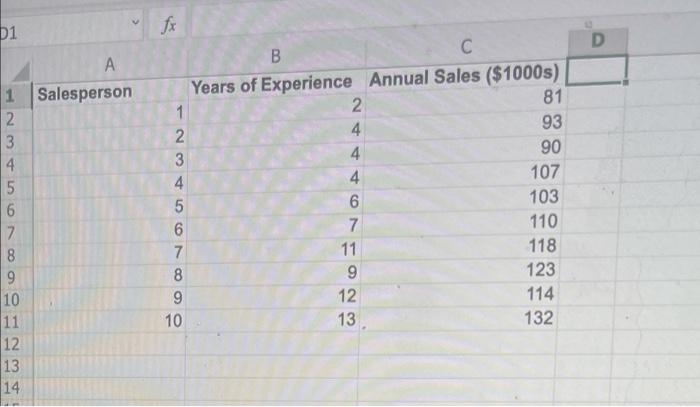
A sales manager collected data on annual sales for new customer accounts and the number of years of experience for a sample of 10 salespersons. In the Microsoft Excel Online file below you will find a sample of data on years of experience of the salesperson and annual sales. Conduct a regression analysis to explore the relationship between these two variables and then answer the following questions X Open spreadsheet a. Computeb and bo (to 1 decimal). 1 4.2 bo 78.1 Complete the estimated regression equation (to 1 decimal) y - 3.6 82.8 b. According to this model, what is the change in annual sales (51000) for every year of experience (to 1 decimal)? C. Compute the coefficient of determination (to 3 decimals). Noter report between 0 and 1. what percentage of the variation in annual sales (510005) can be explained by the years of experience of the salesperson (to 1 decima!)? 82.8 % d. A new salesperson foins the team with 8 years of experience. What is the estimated annual sales ($10008) for the new salesperson (to the nearest whole number) 111 1 D A 1 Salesperson 2 3 4 5 6 7 8 9 10 11 12 13 14 fx B Years of Experience Annual Sales ($1000s) 2 81 4 93 2 4 90 4 107 6 103 7 110 7 11 118 8 9 123 9 12 114 10 13 132 vo AWN A sales manager collected data on annual sales for new customer accounts and the number of years of experience for a sample of 10 salespersons. In the Microsoft Excel Online file below you will find a sample of data on years of experience of the salesperson and annual sales. Conduct a regression analysis to explore the relationship between these two variables and then answer the following questions X Open spreadsheet a. Computeb and bo (to 1 decimal). 1 4.2 bo 78.1 Complete the estimated regression equation (to 1 decimal) y - 3.6 82.8 b. According to this model, what is the change in annual sales (51000) for every year of experience (to 1 decimal)? C. Compute the coefficient of determination (to 3 decimals). Noter report between 0 and 1. what percentage of the variation in annual sales (510005) can be explained by the years of experience of the salesperson (to 1 decima!)? 82.8 % d. A new salesperson foins the team with 8 years of experience. What is the estimated annual sales ($10008) for the new salesperson (to the nearest whole number) 111 1 D A 1 Salesperson 2 3 4 5 6 7 8 9 10 11 12 13 14 fx B Years of Experience Annual Sales ($1000s) 2 81 4 93 2 4 90 4 107 6 103 7 110 7 11 118 8 9 123 9 12 114 10 13 132 vo AWN Step by Step Solution
There are 3 Steps involved in it
Step: 1

Get Instant Access to Expert-Tailored Solutions
See step-by-step solutions with expert insights and AI powered tools for academic success
Step: 2

Step: 3
Ace Your Homework with AI
Get the answers you need in no time with our AI-driven, step-by-step assistance
Get Started
The Handbook Of The Political Economy Of Financial Crises
Authors: Martin H. Wolfson, Gerald A. Epstein
1st Edition
0199757232, 978-0199757237