DAta needed for data analysis missing from lab 6
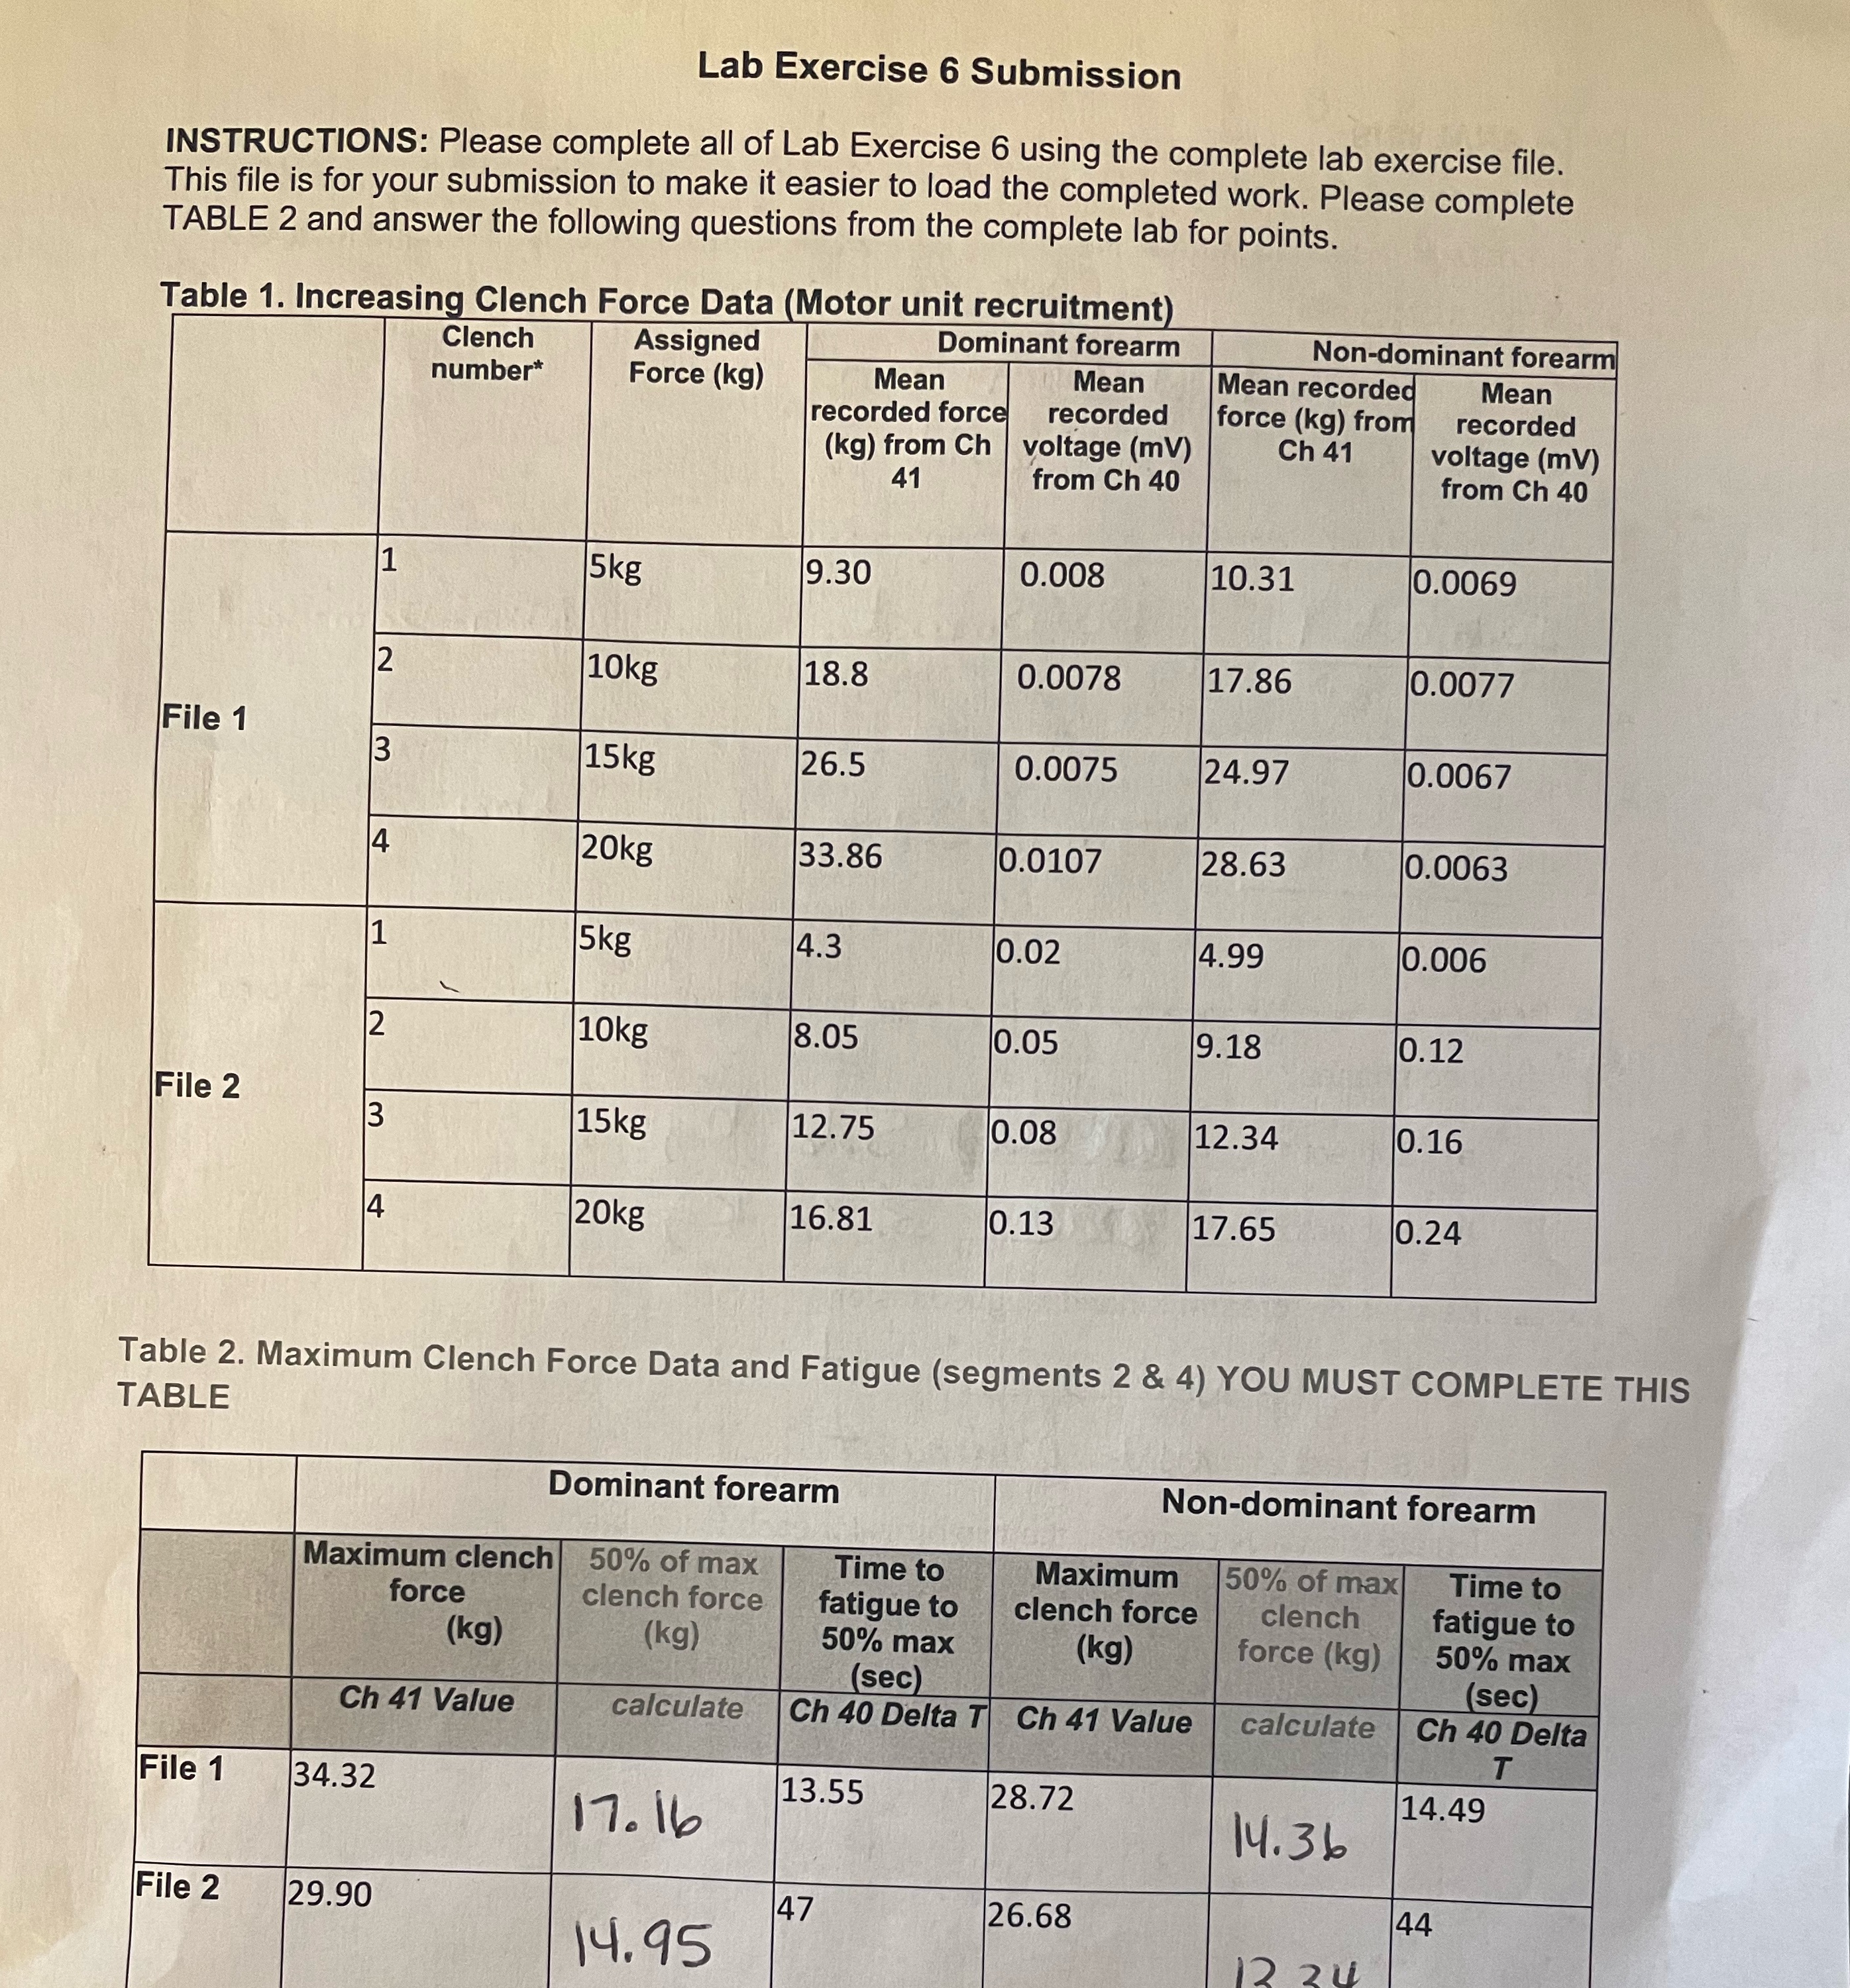
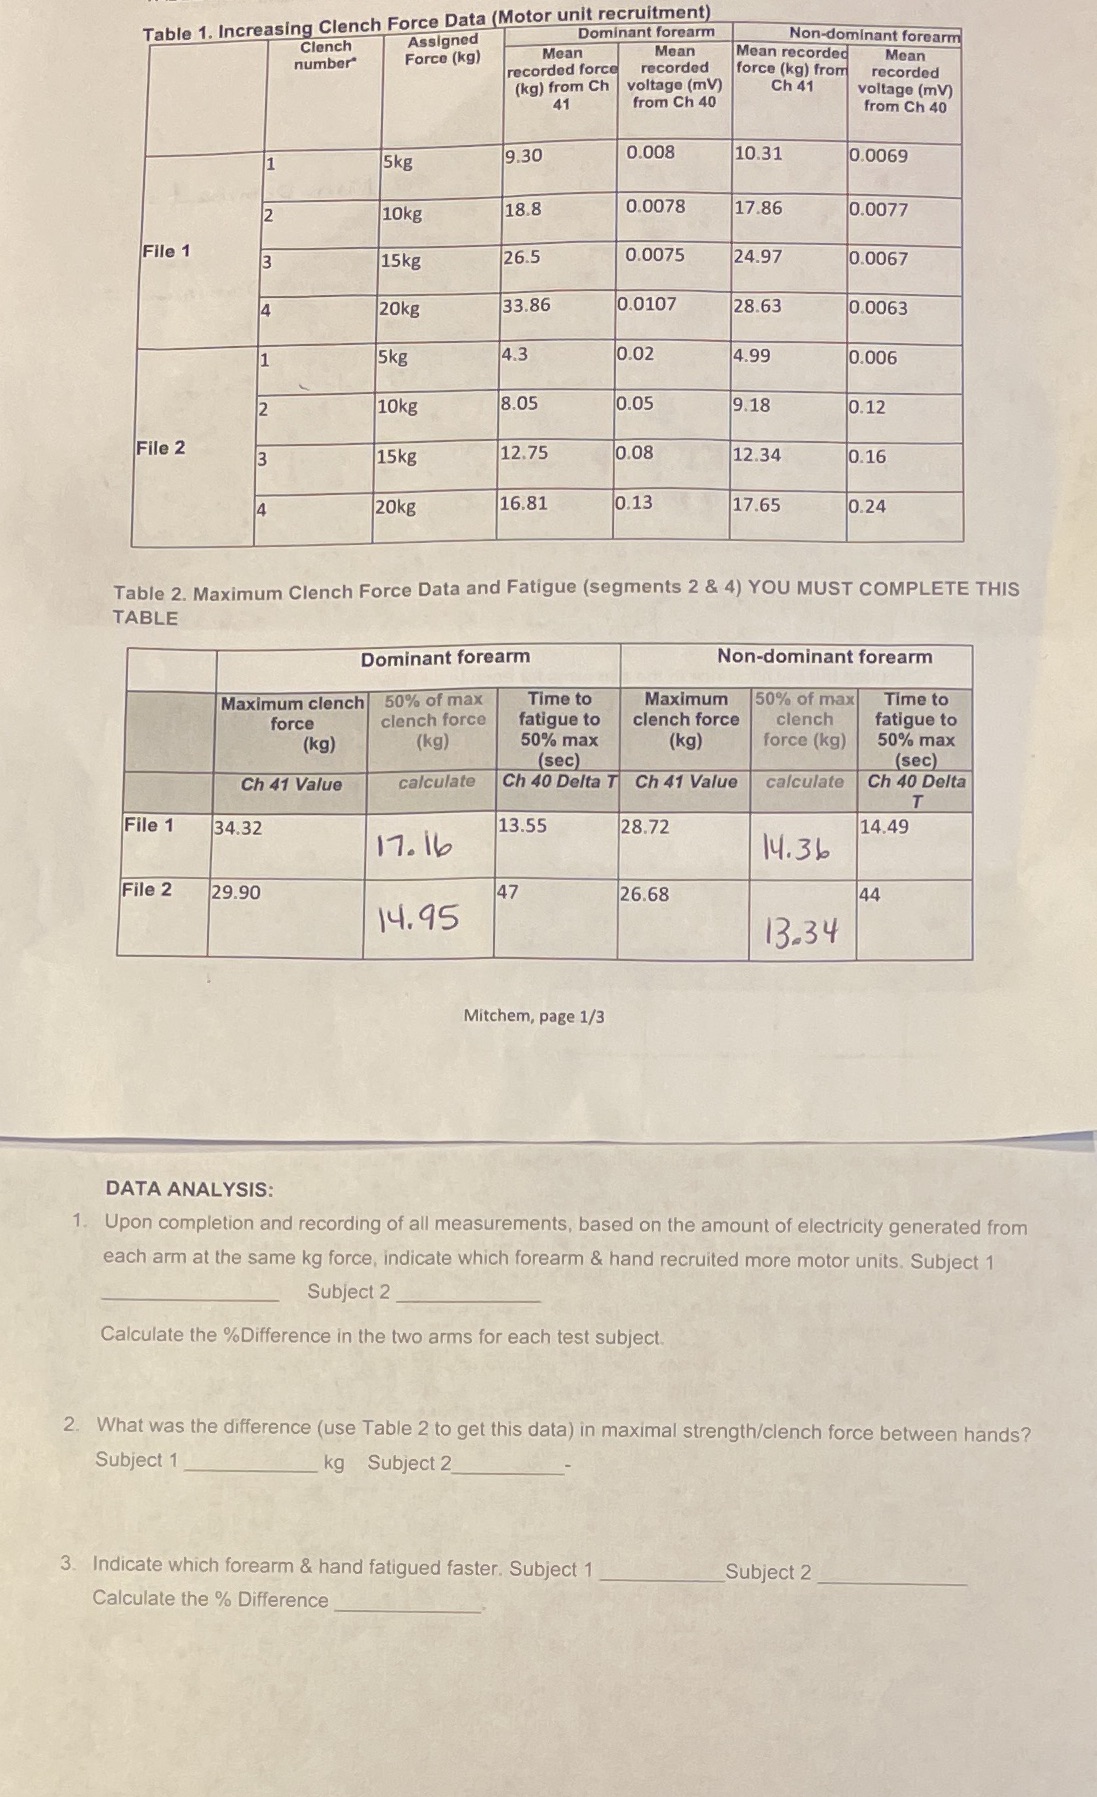
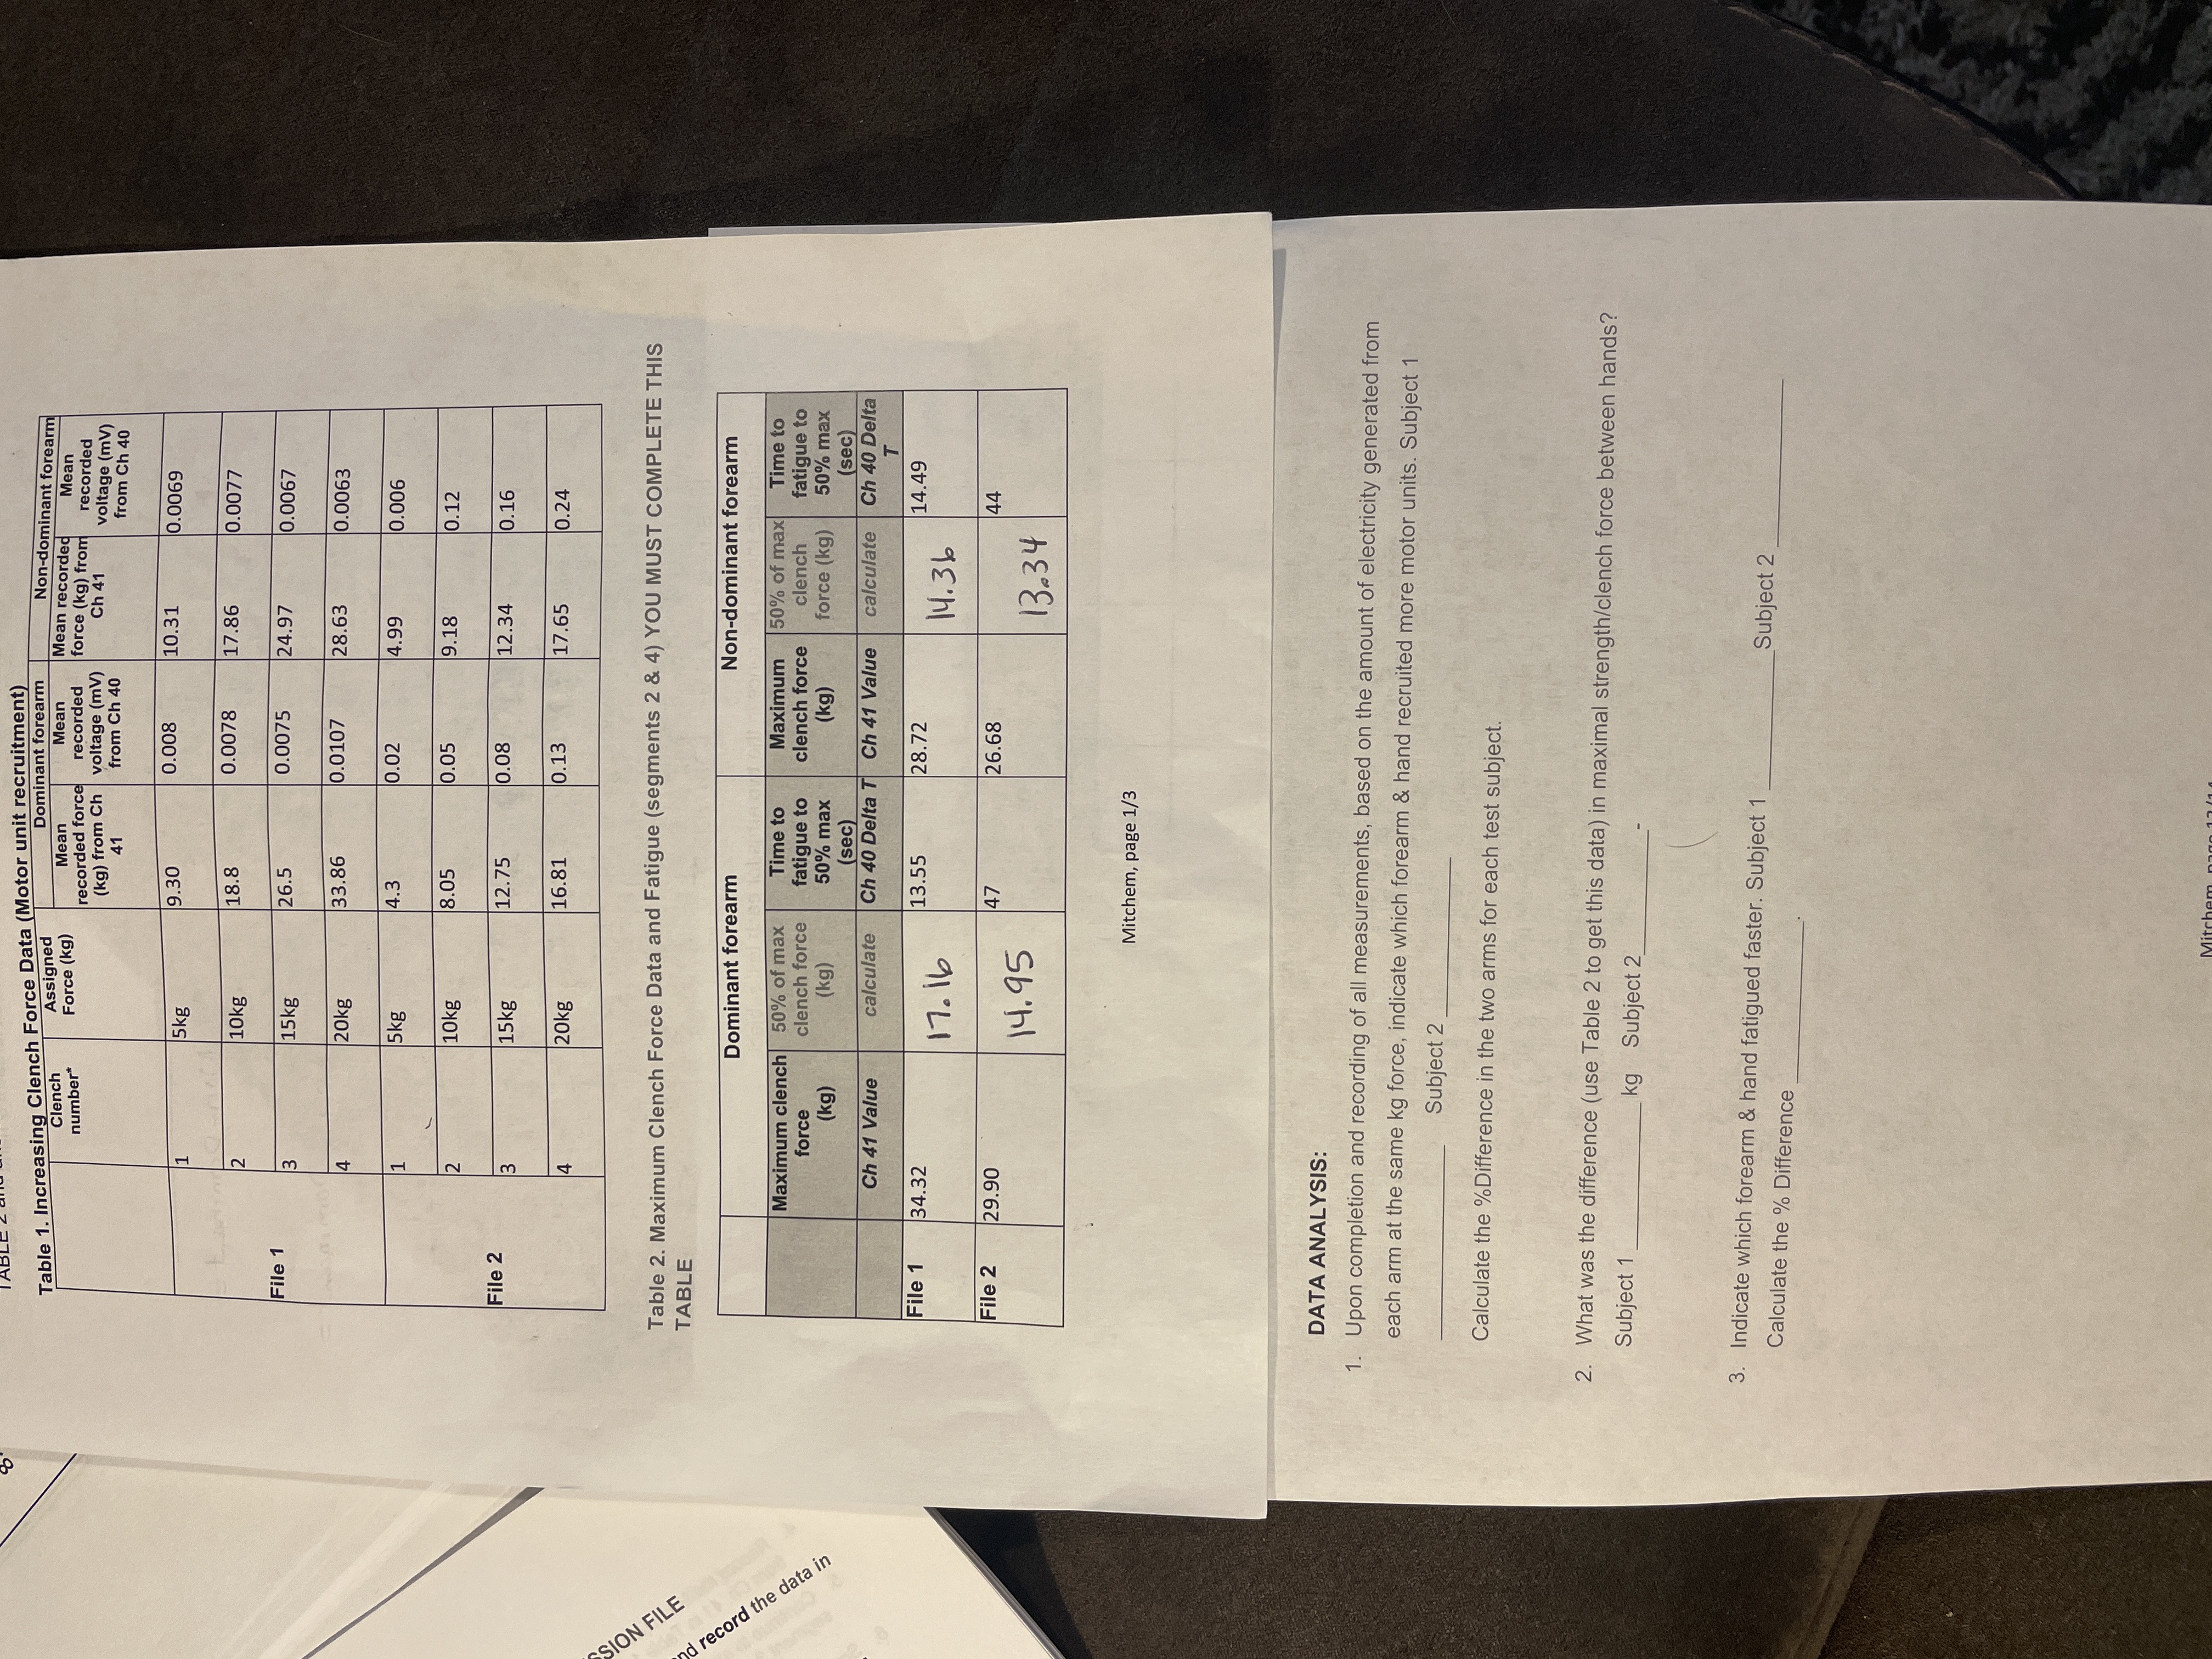
Lab Exercise 6 Submission INSTRUCTIONS: Please complete all of Lab Exercise 6 using the complete lab exercise file. This file is for your submission to make it easier to load the completed work. Please complete TABLE 2 and answer the following questions from the complete lab for points. Table 1. Increasing Clench Force Data (Motor unit recruitment) Clench Assigned Dominant forearm Non-dominant forearm number* Force (kg) Mean Mean Mean recorded Mean recorded force recorded force (kg) from recorded (kg) from Ch | voltage (mV) Ch 41 voltage (mV) 41 from Ch 40 from Ch 40 1 5kg 9.30 0.008 10.31 0.0069 2 10kg 18.8 0.0078 17.86 0.0077 File 1 3 15kg 26.5 0.0075 24.97 0.0067 4 20kg 33.86 0.0107 28.63 0.0063 1 5kg 4.3 0.02 4.99 0.006 2 10kg 8.05 0.05 9.18 0.12 File 2 13 15kg 12.75 0.08 12.34 0.16 4 20kg 16.81 0.13 17.65 0.24 Table 2. Maximum Clench Force Data and Fatigue (segments 2 & 4) YOU MUST COMPLETE THIS TABLE Dominant forearm Non-dominant forearm Maximum clench 50% of max Time to Maximum 50% of max Time to force clench force fatigue to clench force clench fatigue to (kg) (kg) 50% max (kg) force (kg) 50% max (sec) (sec) Ch 41 Value calculate Ch 40 Delta T Ch 41 Value calculate Ch 40 Delta File 1 34.32 13.55 28.72 14.49 17. 16 14.36 File 2 29.90 47 26.68 44 14.95Table 1. Increasing Clench Force Data (Motor unit recruitment) Assigned Dominant forearm Non-dominant forearm Clench Mean Mean Mean recorded Mean number Force (kg) recorded force recorded force (kg) from recorded (kg) from Ch voltage (mV) Ch 41 voltage (mV) 41 from Ch 40 from Ch 40 5kg 9.30 0.008 10.31 0.0069 10kg 18.8 0.0078 17.86 2 0.0077 File 1 0.0075 24.97 3 15kg 26.5 0.0067 20kg 33.86 0.0107 28.63 0.0063 5kg 4 3 0.02 4.99 1 0.006 2 10kg 8.05 0.05 9.18 0.12 File 2 3 15kg 12.75 0.08 12.34 0.16 20kg 16.81 0.13 17.65 0.24 Table 2. Maximum Clench Force Data and Fatigue (segments 2 & 4) YOU MUST COMPLETE THIS TABLE Dominant forearm Non-dominant forearm Maximum clench 50% of max Time to Maximum 50% of max Time to force clench force fatigue to clench force clench fatigue to (kg) (kg) 50% max (kg) force (kg) 50% max (sec) (sec) Ch 41 Value calculate Ch 40 Delta T Ch 41 Value calculate Ch 40 Delta File 1 134.32 13.55 28.72 14.49 17. 16 14.36 File 2 29.90 47 26.68 44 14.95 13.34 Mitchem, page 1/3 DATA ANALYSIS: 1 . Upon completion and recording of all measurements, based on the amount of electricity generated from each arm at the same kg force, indicate which forearm & hand recruited more motor units. Subject 1 Subject 2 Calculate the %Difference in the two arms for each test subject. 2. What was the difference (use Table 2 to get this data) in maximal strength/clench force between hands? Subject 1 kg Subject 2 3. Indicate which forearm & hand fatigued faster. Subject 1 Subject 2 Calculate the % DifferenceTable 1. Increasing Clench Force Data (Motor unit recruitment) Assigned Dominant forearm Non-dominant forearm Clench Mean Mean Mean recorded Mean number Force (kg) recorded force recorded force (kg) from (kg) from Ch |voltage (mV) Ch 41 recorded 41 voltage (mV) from Ch 40 from Ch 40 5k 9.30 0.008 10.31 0.0069 2 10kg 18.8 0.0078 17.86 0.0077 File 1 3 15kg 26.3 0.0075 24.97 0.0067 4 20kg 33.86 0.0107 28.63 0.0063 1 5kg 4.3 0.02 4.99 0.006 10kg 8.05 10.05 9.18 0.12 File 2 3 15kg 12.75 10.08 12.34 0.16 20kg 16.81 0.13 17.65 10.24 SION FILE Table 2. Maximum Clench Force Data and Fatigue (segments 2 & 4) YOU MUST COMPLETE THIS TABLE Dominant forearm Non-dominant forearm d record the data in Maximum clench 50% of max Time to Maximum 50% of max Time to orce clench force fatigue to clench force clench fatigue to (kg (kg) 50% max (kg) force (kg) 50% max (sec) (sec Ch 41 Value calculate Ch 40 Delta T Ch 41 Value calculate Ch 40 Delta File 1 34.32 13.55 28.72 14.49 17. 16 14.36 File 2 29.90 47 26.68 44 14.95 13- 34 Mitchem, page 1/3 DATA ANALYSIS: 1. Upon completion and recording of all measurements, based on the amount of electricity generated from each arm at the same kg force, indicate which forearm & hand recruited more motor units. Subject 1 Subject 2_ Calculate the %Difference in the two arms for each test subject. 2. What was the difference (use Table 2 to get this data) in maximal strength/clench force between hands? Subject 1 kg Subject 2 3. Indicate which forearm & hand fatigued faster. Subject 1 Subject 2 Calculate the % Difference