Answered step by step
Verified Expert Solution
Link Copied!

Question

1 Approved Answer

Data Presentation 1. Consider the ages of 18 faculty members in Mathematics Department. 46 37 45 52 56 26 25 47 55 29 40 31
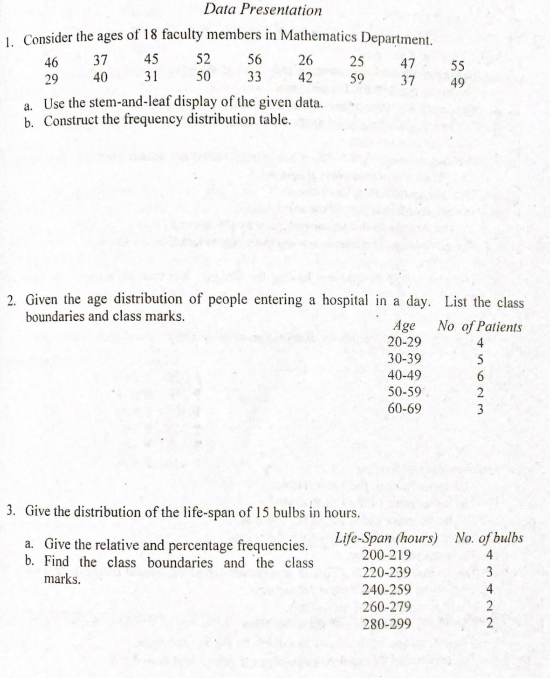
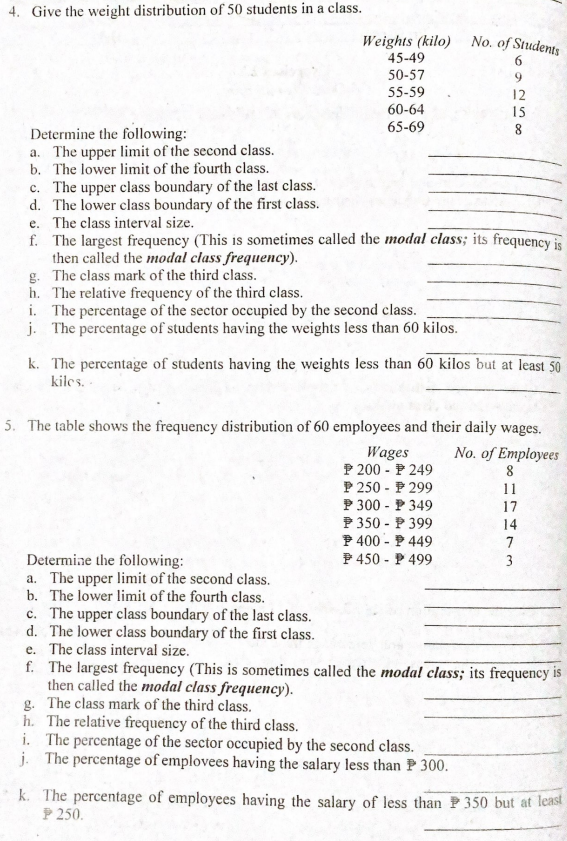
image text in transcribedimage text in transcribed
Data Presentation 1. Consider the ages of 18 faculty members in Mathematics Department. 46 37 45 52 56 26 25 47 55 29 40 31 50 33 42 50 37 49 a. Use the stem-and-leaf display of the given data. b. Construct the frequency distribution table. 2. Given the age distribution of people entering a hospital in a day. List the class boundaries and class marks. Age No of Patients 20-29 30-39 40-49 50-59 60-69 3. Give the distribution of the life-span of 15 bulbs in hours. a. Give the relative and percentage frequencies. Life-Span (hours) No. of bulbs b. Find the class boundaries and the class 200-219 220-239 marks. 240-259 NNAW 260-279 280-2994. Give the weight distribution of 50 students in a class. Weights (kilo) No. of Students 45-49 50-57 55-59 12 60-64 15 Determine the following: 65-69 8 a. The upper limit of the second class. b. The lower limit of the fourth class. c. The upper class boundary of the last class. d. The lower class boundary of the first class. e. The class interval size. f. The largest frequency (This is sometimes called the modal class; its frequency is then called the modal class frequency). g. The class mark of the third class. h. The relative frequency of the third class. i. The percentage of the sector occupied by the second class. j. The percentage of students having the weights less than 60 kilos. k. The percentage of students having the weights less than 60 kilos but at least 50 kilos. . 5. The table shows the frequency distribution of 60 employees and their daily wages. Wages No. of Employees P 200 - P 249 8 P 250 - P 299 11 P 300 - P 349 17 P 350 - P 399 14 P 400 - P 449 Determine the following: P 450 - P 499 w a. The upper limit of the second class. b. The lower limit of the fourth class. c. The upper class boundary of the last class. d. The lower class boundary of the first class. e. The class interval size. f. The largest frequency (This is sometimes called the modal class; its frequency is then called the modal class frequency). g. The class mark of the third class. h. The relative frequency of the third class. i. The percentage of the sector occupied by the second class. j. The percentage of employees having the salary less than P 300. k. The percentage of employees having the salary of less than P 350 but at least P 250

Step by Step Solution

There are 3 Steps involved in it

Step: 1

blur-text-image

Get Instant Access to Expert-Tailored Solutions

See step-by-step solutions with expert insights and AI powered tools for academic success

Step: 2

blur-text-image

Step: 3

blur-text-image

Ace Your Homework with AI

Get the answers you need in no time with our AI-driven, step-by-step assistance

Get Started

Recommended Textbook for

Algebra And Trigonometry Enhanced With Graphing Utilities (Subscription)

Authors: Michael, Michael Sullivan III, Michael III Sullivan, Michael Sullivan 111, III Sullivan

6th Edition

0321849132, 9780321849137

More Books

Students also viewed these Mathematics questions