data

questions
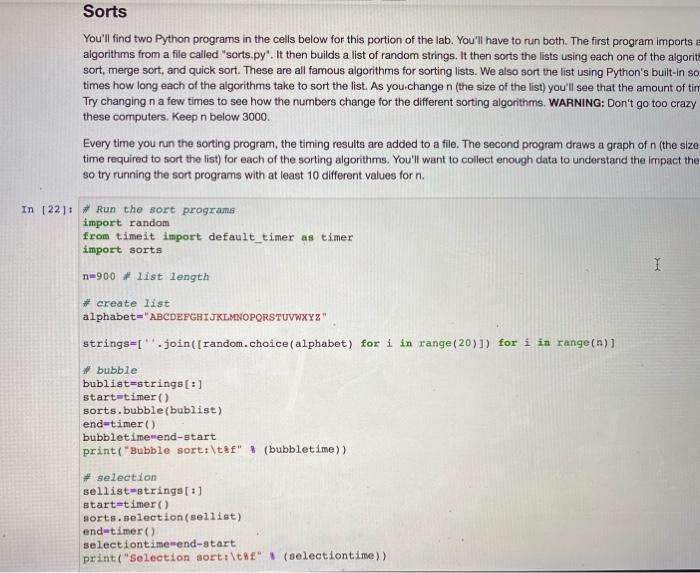
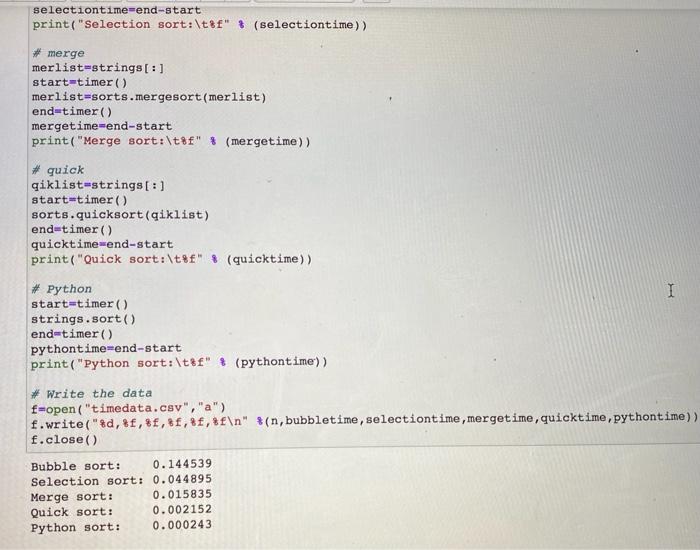
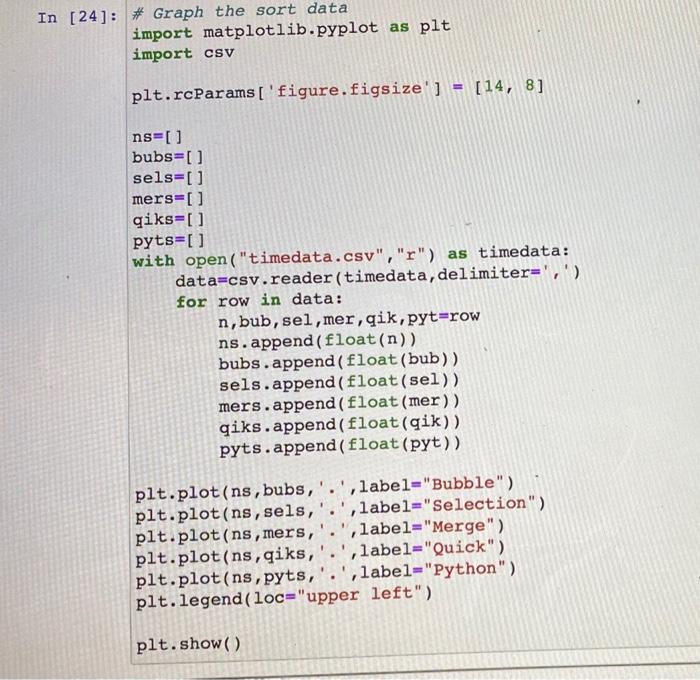
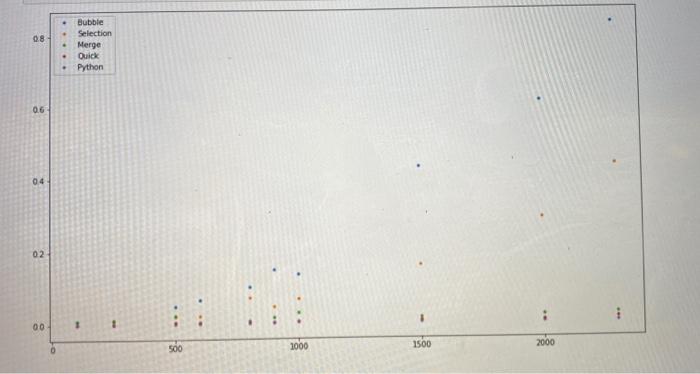
Sorts You'll find two Python programs in the cells below for this portion of the lab. You'll have to run both. The first program imports a algorithms from a file called "sorts.py". It then builds a list of random strings. It then sorts the lists using each one of the algorit sort, merge sort, and quick sort. These are all famous algorithms for sorting lists. We also sort the list using Python's built-in so times how long each of the algorithms take to sort the list. As you change n (the size of the list) you'll see that the amount of tim Try changing n a few times to see how the numbers change for the different sorting algorithms. WARNING: Don't go too crazy these computers. Keep n below 3000. Every time you run the sorting program, the timing results are added to a file. The second program draws a graph of n (the size time required to sort the list) for each of the sorting algorithms. You'll want to collect enough data to understand the impact the so try running the sort programs with at least 10 different values for n. In 122): Run the sort programs import random from timeat import default_timer as timer import sorts I n=900 # list length + create list alphabet="ABCDEFGHIJKLMNOPQRSTUVWXYZ" strings=['..join([random.choice (alphabet) for i in range(20)]) for i in range(n)) bubble bublist-strings[:] start-timer sorts.bubble(bublist) end-timer() bubbletime end-start print("Bubble sort:\taf" (bubbletime)) # selection sellist-strings[:] start-timer() sorts.selection(sellist) end-timer() selectiontime end-start print("selection sort:\th" (selectiontime)) selectiontime=end-start print("Selection sort:\t8f" (selectiontime)) #merge merlist-strings[:] start=timer() merlist-sorts.mergesort (merlist) end-timer) mergetimewend-start print("Merge sort:\t8f" * (mergetime)) #quick giklist=strings[:] start=timer() sorts.quicksort(qiklist) end=timer() quicktime-end-start print("Quick sort:\t%f" * (quicktime)) I Python start=timer) strings.sort() end=timer() pythontime-end-start print("Python sort:\t8f" (pythontime')) # Write the data f=open("timedata.csv","a") f.write("$d,&f, $f, 8f,,&f " %(n, bubbletime, selectiontime, mergetime, quicktime, pythontime)) f.close() Bubble sort: 0.144539 Selection sort: 0.044895 Merge sort: 0.015835 Quick sort: 0.002152 Python sort: 0.000243 In [24]: # Graph the sort data import matplotlib.pyplot as plt import csv plt.rcParams['figure.figsize'] = [14, 8] ns=0 bubs=[] sels=[] mers=[] qiks=[ ] pyts=[] with open("timedata.csv","r") as timedata: data=csv.reader(timedata, delimiter=',') for row in data: n,bub, sel, mer, qik, pyt=row ns.append(float(n)) bubs.append( float(bub)) sels.append(float(sel)) mers.append(float (mer)) qiks.append(float(qik)) pyts.append(float (pyt)) . 1 plt.plot(ns, bubs,'.', label="Bubble") plt.plot(ns, sels, , label="Selection") plt.plot(ns, mers, label="Merge") plt.plot(ns, qiks,'.',label="Quick") plt.plot(ns, pyts,'.',label="Python") plt.legend (loc="upper left") plt.show() 08 Bubble Selection Merge Quick Python 06 04 02 1 00 1 500 1000 1500 2000 5. We say the sorting programs "sort the list of strings." What does that mean? What order are the strings put in? 6. As you double n (the size of the lists, how does the runtime change for each of the sorting algorithms


