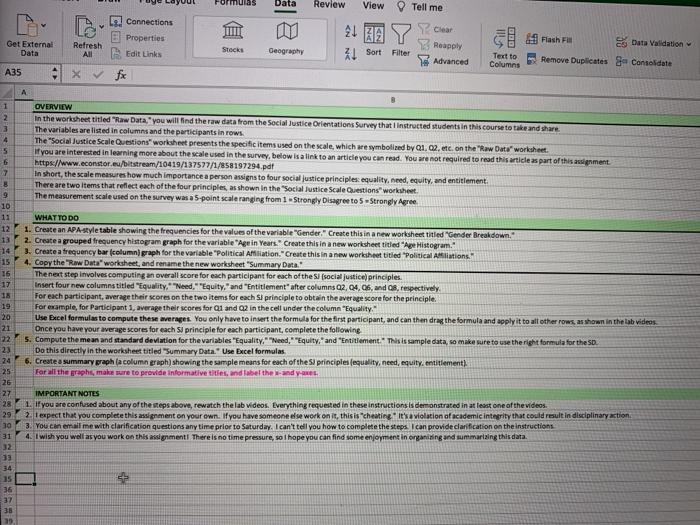
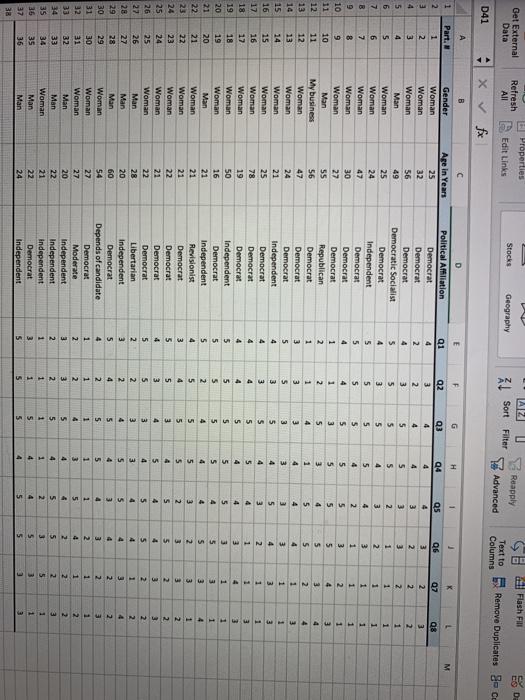
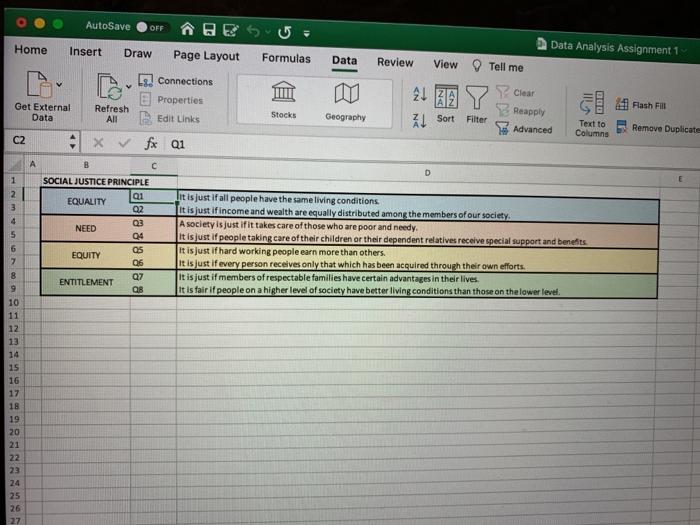
Data Review View Tell me v . Connections Properties Edit Links 5 Get External Data Refresh All Stecks Geography 31 Sort Filter Reapoly Advanced Data Validation Remove Duplicates & Consolidate Text to Columns A35 A 1 2 3 4 15 6 OVERVIEW In the worksheet titled "Raw Data."you will find the raw data from the Social Justice Orientations Survey that instructed students in this course to take and share. The variables are listed in columns and the participants in rows. The Social Justice Scale Questions worksheet presents the specific items used on the scale, which are symbolized by Q1, Q2. etc. on the "Raw Data worksheet if you are interested in learning more about the scale used in the survey, below is a link to an article you can read. You are not required to read this article as part of this assignment https://www.econstar.eu/bitstream/10419/137577/1/858197294.pdf In short, the scale measures how much importance a person assigns to four social justice principles equality need equity, and entitlement There are two items that reflect each of the four principles, as shown in the Social Justice Scale Questions worksheet The measurement scale used on the survey was a 5-point scale ranging from 1 Strongly Disagree to 5 -Strongly Agree 8 10 11 12 WHAT TO DO 1. Create an APA-style table showing the frequencies for the values of the variable "Gender" Create this in a new worksheet titled "Gender Breakdown. 2. Create a grouped frequency histogram graph for the variable "Age in Years. Create this in a new worksheet titled Age Histogram." 3. Create a frequency bar (column) graph for the variable Political Aliation. Create this in a new worksheet titled "Political Aliations. 4. Copy the Raw Data worksheet, and rename the new worksheet Summary Data The next step involves computing an overall score for each participant for each of the social justice principles Insert four new columns titled "Equality," "Need," "Equity," and "Entitlement after columns 02, 04.06, and Q8, respectively For each participant, average their scores on the two items for each si principle to obtain the average score for the principle. For example, for Participants, average their scores for Q1 and 2 in the cell under the column "Equality Use Excel formulas to compute these averages. You only have to insert the formula for the first participant, and can then drag the formula and apply it to all other rows, as shown in the lab videos Once you have your average scores for each 5J principle for each participant complete the following 5. Compute the mean and standard deviation for the variables "Equality." "Need, Equity," and "Entitlement. This is sample data, so make sure to use the right formula for the SD Do this directly in the worksheet titled "Summary Data. Use Excel formulas 6. Create a summary graph la column graph) showing the sample means for each of the Si principles equality, need, equity entitlement) for all the graphs, make sure to provide informative titles, and label the sand yes 14 15 16 17 18 19 20 21 22 23 24 25 26 27 28 29 10 31 32 33 34 15 36 37 38 29 IMPORTANT NOTES 1. If you are confused about any of the steps above, rewatch the lab videos. Everything requested in these instructions is demonstrated in at least one of the videos. 2. Texpect that you complete this assignment on your own. If you have someone else work on it, this is cheating it'sa violation of academic integrity that could result in disciplinary action 3. You can email me with clarification questions any time prior to Saturday. I can't tell you how to complete the steps I can provide clarification on the instructions 4. I wish you well as you work on this assignment. There is no time pressure, so I hope you can find some enjoyment in organizing and summarizing this data. 5 AZ Get External Data Ball Flash FH Stocks Geography Properties Refresh All Edit Links x fe Al Sort Filter Reapply Advanced Text to Columns Remove Duplicates - CE D41 C D E F G H 1 K M 1 2 Q1 Are in Years 225 32 56 Q3 4 L Q8 Q5 4 NNA 4 4 5 Q2 3 2 3 5 3 5 5 OG 3 2 3 1 2 2 4 5 4 5 5 5 6 7 B 5 2 2 1 1 3 2 1 1 1 1 1 49 25 24 47 30 27 55 56 47 5 5 5 5 94 4 4 5 5 4 5 4 5 5 3 1 4 1 1 4 Part. 1 2 3 4 5 6 7 8 9 10 11 12 13 14 15 16 12 19 4 10 1 3 3 2 3 4 2 5 5 4 5 4 3 5 3 1 2 2 4 1 3 4 3 5 4 2 1 1 3 1 3 5 5 5 4 3 4 2 3 3 2 1 1 3 5 4 3 24 3 4 5 4 4 4 21 25 78 19 50 16 3 1 1 4 3 1 3 Gender Woman Woman Woman Man Woman Woman Woman Woman Woman Man My business Woman Woman Woman Woman Woman Woman Woman Woman Man Woman Woman Woman Woman Woman Man Man Man Woman Woman Woman Man Man Woman Man Man 4 11 12 13 14 15 16 17 18 19 20 21 22 23 24 25 26 27 28 29 3 3 5 $ 5 5 5 5 Political Affiliation Democrat Democrat Democrat Democratic Socialist Democrat Independent Democrat Democrat Democrat Republican Democrat Democrat Democrat Independent Democrat Democrat Democrat Independent Democrat Independent Revisionist Democrat Democrat Democrat Democrat Libertarian Independent Democrat Depends of candidate Democrat Moderate Independent Independent Independent Democrat Independent 4 5 4 5 5 3 3 3 4 4 5 5 2 5 4 4 5 19 1 3 3 5 5 2 1 3 4 5 5 5 4 3 5 4 20 4 5 3 3 4 5 5 3 4 3 3 2. 5 3 3 5 4 4 5 1 1 4 1 2 2 3 2 2 21 21 21 22 21 22 28 20 60 54 27 27 5 4 5 4 3 5 5 3 5 2 2 4 4 5 4 5 2 3 2 1 5 4 3 4 4 4 21 22 23 24 25 26 27 28 29 30 31 32 33 34 35 35 3 2 5 5 4 5 2 2 3 2 1 2 3 5 4 1 2 3 2 1 3 5 1 3 3 1 2 2 1 2 20 22 2 1 2 3 2 1 1 5 1 4 5 5 1 5 5 4 2 5 33 34 35 35 37 38 1 5 4 5 2 4 5 4 4 1 4 4 2 5 21 22 24 3 1 1 5 5 3 3 3 AutoSave OFF BE Page Layout Home Data Analysis Assignment 1 Insert Draw Formulas Data Review View Tell me Connections Get External Data Refresh All Properties Edit Links 21 2 7 Clear Al Sort Reapply Stocks Geography & Fash Fu Remove Duplicate Filter Advanced Text to Columns C2 fx 01 B C D SOCIAL JUSTICE PRINCIPLE 1 2 EQUALITY 3 4 NEED lalalalala 5 04 it is just if all people have the same living conditions it is just if income and wealth are equally distributed among the members of our society A society is just if it takes care of those who are poor and needy. It is just if people taking care of their children or their dependent relatives receive special support and benefits It is just if hard working people earn more than others. It is just if every person receives only that which has been acquired through their own efforts. It is just if members of respectable families have certain advantages in their lives It is fair if people on a higher level of society have better living conditions than those on the lower level 6 EQUITY 7 8 9 ENTITLEMENT QB 10 11 12 13 14 15 16 17 18 19 20 21 22 23 24 25 26 27 2+ 1916 Y Oet External Data Properties Edit Links Refresh All Stocks Geography Sort Filter Reapply Advanced Path Fa E Data Valid Text to Remove Duplicates & Consolidar Columns A35 x fx A 8 OVERVIEW In the worksheet titled "Raw Data' you will find the raw data from the Social Justice Orientations Survey that instructed students in this course to take and share. The variables are listed in columns and the participants in rows. The Social Justice Scale Questions worksheet presents the specific items used on the scale, which are symbolized by Q1, Q2, etc. on the "Raw Data worksheet if you are interested in learning more about the scale used in the survey, below is a link to an article you can read. You are not required to read this article as part of this assignment https://www.econstor.eu/bitstream/10419/137577/1/858197294.pdf In short, the scale measures how much importance a person assigns to four social justice principles: equality, need, equity, and entitlement There are two items that reflect each of the four principles, as shown in the Social Justice Scale Questions worksheet The measurement scale used on the survey was a 5 point scale ranging from 1 Strongly Disagree to 5 Strongly Agree WHAT TO DO 1. Create an APA-style table showing the frequencies for the values of the variable"Gender. Create this in a new worksheet titled "Gender Breakdown." 2. Create a grouped frequency histogram graph for the variable "Age in Years. Create this in a new worksheet titled "Age Histogram 3. Create a frequency bar column) graph for the variable Political Affiliation.Create this in a new worksheet titled "Political Affiliations. Copy the "Raw Data worksheet, and rename the new worksheet Summary Data The next step involves computing an overall score for each participant for each of the Social justice principles Insert four new columns titled "Equality." "Need, Equity," and "Entitlement after columns 02.04, 06, and respectively, For each participant, average their scores on the two items for each si principle to obtain the average score for the principle. For example, for Participant 1. average their scores for Q1 and 2 in the cell under the column "Equality Use Excel formulas to compute these averages. You only have to insert the formula for the first participant, and can then drag the formula and apply it to all other rows, as shown in the lab videos Once you have your average scores for each s principle for each participant, complete the following S. Compute the mean and standard deviation for the variables "Equality. "Need," "Equity," and "Entitlement. This is sample data, so make sure to use the right formula for the SD. Do this directly in the worksheet titled "Summary Data "Use Excel formulas 6. Create a summary graph la column wraph) showing the sample means for each of the Si principles (equality, need, equity, entitlementi For all the graphs, make sure to provide informative titles, and label the sand yaxes IMPORTANT NOTES 1. If you are confused about any of the steps above, rewatch the lab videos. Everything requested in these instructions is demonstrated in at least one of the videos 2. expect that you complete this assignment on your own. If you have someone else work on it, this is "cheating. It's a violation of academic integrity that could result in disciplinary action 3. You can email me with clarification questions any time prior to Saturday. I can't tell you how to complete the steps. I can provide clarification on the instructions 4. I wish you well as you work on this assignment There is no time pressure, so I hope you can find some enjoyment in organizing and summarising this data. 2 3 4 + Data Review View Tell me v . Connections Properties Edit Links 5 Get External Data Refresh All Stecks Geography 31 Sort Filter Reapoly Advanced Data Validation Remove Duplicates & Consolidate Text to Columns A35 A 1 2 3 4 15 6 OVERVIEW In the worksheet titled "Raw Data."you will find the raw data from the Social Justice Orientations Survey that instructed students in this course to take and share. The variables are listed in columns and the participants in rows. The Social Justice Scale Questions worksheet presents the specific items used on the scale, which are symbolized by Q1, Q2. etc. on the "Raw Data worksheet if you are interested in learning more about the scale used in the survey, below is a link to an article you can read. You are not required to read this article as part of this assignment https://www.econstar.eu/bitstream/10419/137577/1/858197294.pdf In short, the scale measures how much importance a person assigns to four social justice principles equality need equity, and entitlement There are two items that reflect each of the four principles, as shown in the Social Justice Scale Questions worksheet The measurement scale used on the survey was a 5-point scale ranging from 1 Strongly Disagree to 5 -Strongly Agree 8 10 11 12 WHAT TO DO 1. Create an APA-style table showing the frequencies for the values of the variable "Gender" Create this in a new worksheet titled "Gender Breakdown. 2. Create a grouped frequency histogram graph for the variable "Age in Years. Create this in a new worksheet titled Age Histogram." 3. Create a frequency bar (column) graph for the variable Political Aliation. Create this in a new worksheet titled "Political Aliations. 4. Copy the Raw Data worksheet, and rename the new worksheet Summary Data The next step involves computing an overall score for each participant for each of the social justice principles Insert four new columns titled "Equality," "Need," "Equity," and "Entitlement after columns 02, 04.06, and Q8, respectively For each participant, average their scores on the two items for each si principle to obtain the average score for the principle. For example, for Participants, average their scores for Q1 and 2 in the cell under the column "Equality Use Excel formulas to compute these averages. You only have to insert the formula for the first participant, and can then drag the formula and apply it to all other rows, as shown in the lab videos Once you have your average scores for each 5J principle for each participant complete the following 5. Compute the mean and standard deviation for the variables "Equality." "Need, Equity," and "Entitlement. This is sample data, so make sure to use the right formula for the SD Do this directly in the worksheet titled "Summary Data. Use Excel formulas 6. Create a summary graph la column graph) showing the sample means for each of the Si principles equality, need, equity entitlement) for all the graphs, make sure to provide informative titles, and label the sand yes 14 15 16 17 18 19 20 21 22 23 24 25 26 27 28 29 10 31 32 33 34 15 36 37 38 29 IMPORTANT NOTES 1. If you are confused about any of the steps above, rewatch the lab videos. Everything requested in these instructions is demonstrated in at least one of the videos. 2. Texpect that you complete this assignment on your own. If you have someone else work on it, this is cheating it'sa violation of academic integrity that could result in disciplinary action 3. You can email me with clarification questions any time prior to Saturday. I can't tell you how to complete the steps I can provide clarification on the instructions 4. I wish you well as you work on this assignment. There is no time pressure, so I hope you can find some enjoyment in organizing and summarizing this data. 5 AZ Get External Data Ball Flash FH Stocks Geography Properties Refresh All Edit Links x fe Al Sort Filter Reapply Advanced Text to Columns Remove Duplicates - CE D41 C D E F G H 1 K M 1 2 Q1 Are in Years 225 32 56 Q3 4 L Q8 Q5 4 NNA 4 4 5 Q2 3 2 3 5 3 5 5 OG 3 2 3 1 2 2 4 5 4 5 5 5 6 7 B 5 2 2 1 1 3 2 1 1 1 1 1 49 25 24 47 30 27 55 56 47 5 5 5 5 94 4 4 5 5 4 5 4 5 5 3 1 4 1 1 4 Part. 1 2 3 4 5 6 7 8 9 10 11 12 13 14 15 16 12 19 4 10 1 3 3 2 3 4 2 5 5 4 5 4 3 5 3 1 2 2 4 1 3 4 3 5 4 2 1 1 3 1 3 5 5 5 4 3 4 2 3 3 2 1 1 3 5 4 3 24 3 4 5 4 4 4 21 25 78 19 50 16 3 1 1 4 3 1 3 Gender Woman Woman Woman Man Woman Woman Woman Woman Woman Man My business Woman Woman Woman Woman Woman Woman Woman Woman Man Woman Woman Woman Woman Woman Man Man Man Woman Woman Woman Man Man Woman Man Man 4 11 12 13 14 15 16 17 18 19 20 21 22 23 24 25 26 27 28 29 3 3 5 $ 5 5 5 5 Political Affiliation Democrat Democrat Democrat Democratic Socialist Democrat Independent Democrat Democrat Democrat Republican Democrat Democrat Democrat Independent Democrat Democrat Democrat Independent Democrat Independent Revisionist Democrat Democrat Democrat Democrat Libertarian Independent Democrat Depends of candidate Democrat Moderate Independent Independent Independent Democrat Independent 4 5 4 5 5 3 3 3 4 4 5 5 2 5 4 4 5 19 1 3 3 5 5 2 1 3 4 5 5 5 4 3 5 4 20 4 5 3 3 4 5 5 3 4 3 3 2. 5 3 3 5 4 4 5 1 1 4 1 2 2 3 2 2 21 21 21 22 21 22 28 20 60 54 27 27 5 4 5 4 3 5 5 3 5 2 2 4 4 5 4 5 2 3 2 1 5 4 3 4 4 4 21 22 23 24 25 26 27 28 29 30 31 32 33 34 35 35 3 2 5 5 4 5 2 2 3 2 1 2 3 5 4 1 2 3 2 1 3 5 1 3 3 1 2 2 1 2 20 22 2 1 2 3 2 1 1 5 1 4 5 5 1 5 5 4 2 5 33 34 35 35 37 38 1 5 4 5 2 4 5 4 4 1 4 4 2 5 21 22 24 3 1 1 5 5 3 3 3 AutoSave OFF BE Page Layout Home Data Analysis Assignment 1 Insert Draw Formulas Data Review View Tell me Connections Get External Data Refresh All Properties Edit Links 21 2 7 Clear Al Sort Reapply Stocks Geography & Fash Fu Remove Duplicate Filter Advanced Text to Columns C2 fx 01 B C D SOCIAL JUSTICE PRINCIPLE 1 2 EQUALITY 3 4 NEED lalalalala 5 04 it is just if all people have the same living conditions it is just if income and wealth are equally distributed among the members of our society A society is just if it takes care of those who are poor and needy. It is just if people taking care of their children or their dependent relatives receive special support and benefits It is just if hard working people earn more than others. It is just if every person receives only that which has been acquired through their own efforts. It is just if members of respectable families have certain advantages in their lives It is fair if people on a higher level of society have better living conditions than those on the lower level 6 EQUITY 7 8 9 ENTITLEMENT QB 10 11 12 13 14 15 16 17 18 19 20 21 22 23 24 25 26 27 2+ 1916 Y Oet External Data Properties Edit Links Refresh All Stocks Geography Sort Filter Reapply Advanced Path Fa E Data Valid Text to Remove Duplicates & Consolidar Columns A35 x fx A 8 OVERVIEW In the worksheet titled "Raw Data' you will find the raw data from the Social Justice Orientations Survey that instructed students in this course to take and share. The variables are listed in columns and the participants in rows. The Social Justice Scale Questions worksheet presents the specific items used on the scale, which are symbolized by Q1, Q2, etc. on the "Raw Data worksheet if you are interested in learning more about the scale used in the survey, below is a link to an article you can read. You are not required to read this article as part of this assignment https://www.econstor.eu/bitstream/10419/137577/1/858197294.pdf In short, the scale measures how much importance a person assigns to four social justice principles: equality, need, equity, and entitlement There are two items that reflect each of the four principles, as shown in the Social Justice Scale Questions worksheet The measurement scale used on the survey was a 5 point scale ranging from 1 Strongly Disagree to 5 Strongly Agree WHAT TO DO 1. Create an APA-style table showing the frequencies for the values of the variable"Gender. Create this in a new worksheet titled "Gender Breakdown." 2. Create a grouped frequency histogram graph for the variable "Age in Years. Create this in a new worksheet titled "Age Histogram 3. Create a frequency bar column) graph for the variable Political Affiliation.Create this in a new worksheet titled "Political Affiliations. Copy the "Raw Data worksheet, and rename the new worksheet Summary Data The next step involves computing an overall score for each participant for each of the Social justice principles Insert four new columns titled "Equality." "Need, Equity," and "Entitlement after columns 02.04, 06, and respectively, For each participant, average their scores on the two items for each si principle to obtain the average score for the principle. For example, for Participant 1. average their scores for Q1 and 2 in the cell under the column "Equality Use Excel formulas to compute these averages. You only have to insert the formula for the first participant, and can then drag the formula and apply it to all other rows, as shown in the lab videos Once you have your average scores for each s principle for each participant, complete the following S. Compute the mean and standard deviation for the variables "Equality. "Need," "Equity," and "Entitlement. This is sample data, so make sure to use the right formula for the SD. Do this directly in the worksheet titled "Summary Data "Use Excel formulas 6. Create a summary graph la column wraph) showing the sample means for each of the Si principles (equality, need, equity, entitlementi For all the graphs, make sure to provide informative titles, and label the sand yaxes IMPORTANT NOTES 1. If you are confused about any of the steps above, rewatch the lab videos. Everything requested in these instructions is demonstrated in at least one of the videos 2. expect that you complete this assignment on your own. If you have someone else work on it, this is "cheating. It's a violation of academic integrity that could result in disciplinary action 3. You can email me with clarification questions any time prior to Saturday. I can't tell you how to complete the steps. I can provide clarification on the instructions 4. I wish you well as you work on this assignment There is no time pressure, so I hope you can find some enjoyment in organizing and summarising this data. 2 3 4 +