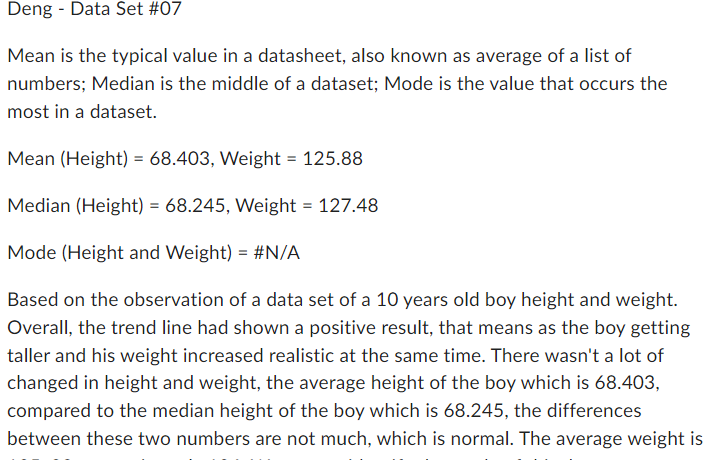
Data Set 07 Height (in) Weight (Ibs) Height (in) Weight (lbs) MEAN 68.403 125.8805 65.8 119.88 MODE #N/A #N/A 67.21 109.01 MEDIAN 68.245 127.48 69.42
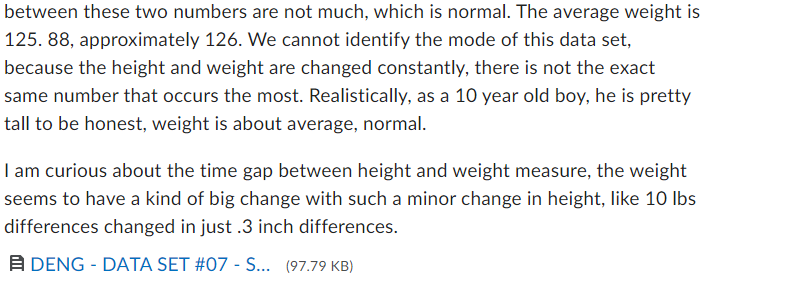
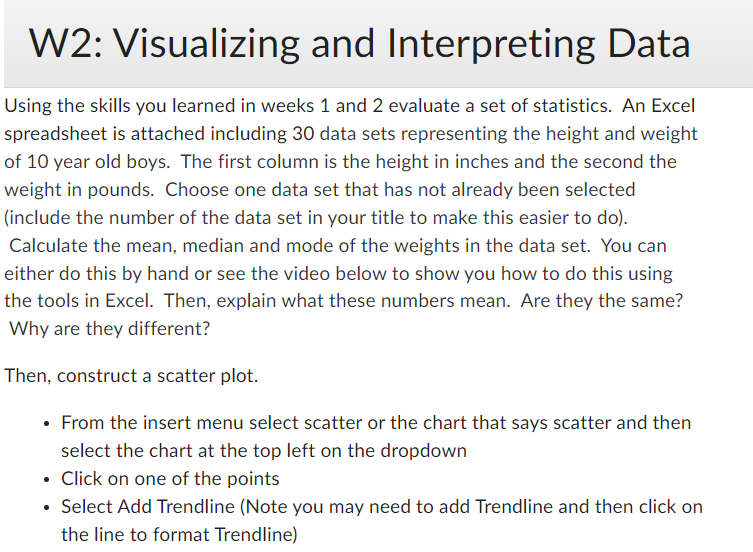
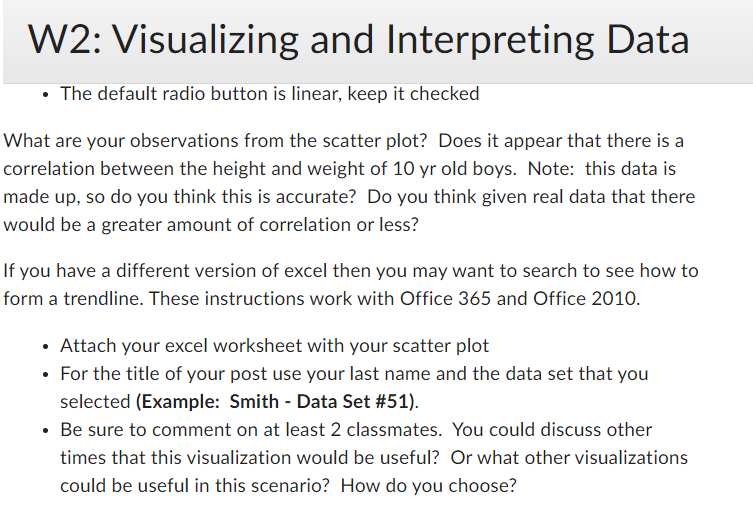
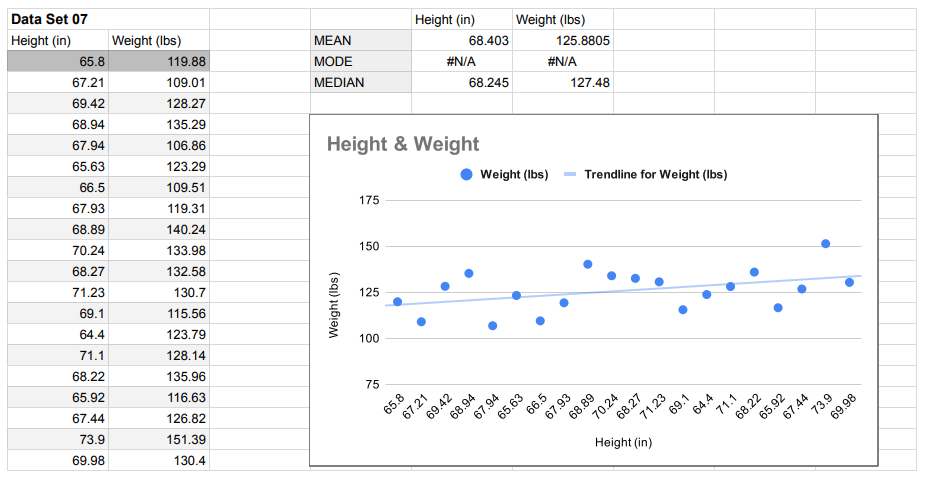
Data Set 07 Height (in) Weight (Ibs) Height (in) Weight (lbs) MEAN 68.403 125.8805 65.8 119.88 MODE #N/A #N/A 67.21 109.01 MEDIAN 68.245 127.48 69.42 128.27 68.94 135.29 67.94 106.86 Height & Weight 65.63 123.29 Weight (lbs) - Trendline for Weight (Ibs) 66.5 109.51 67.93 119.31 175 68.89 140.24 70.24 133.98 150 68.27 132.58 71.23 130.7 125 Weight (Ibs ) 69.1 115.56 64.4 123.79 100 71.1 128.14 68.22 135.96 75 65.92 116.63 65.8 94 67.21 69.42 67.94 66.5 67.93 68.89 0.24 68.27 71.23 69.1 64.4 71.1 68.22 65.92 73.9 69.98 67.44 67.44 126.82 68. 65.6 73.9 151.39 Height (in) 69.98 130.4between these two numbers are not much, which is normal. The ayerage weight is 125. 88, approximately 126. We cannot identify the mode of this data set, because the height and weight are changed constantly, there is not the exact same number that occurs the most. Realistically, as a 10 year old boy, he is pretty tall to be honest, weight is about ayerage, normal. I am curious about the time gap between height and weight measure, the weight seems to haye a kind of big change with such a minor change in height, like 10 lbs differences changed in just .3 inch differences. E DENG DATA SET #0? S... (91?? KB} Deng - Data Set #07 Mean is the typical value in a datasheet, also known as average of a list of numbers; Median is the middle of a dataset; Mode is the value that occurs the most in a dataset. Mean (Height) = 68.403, Weight = 125.88 Median (Height) = 68.245, Weight = 127.48 Mode (Height and Weight) = #N/A Based on the observation of a data set of a 10 years old boy height and weight. Overall, the trend line had shown a positive result, that means as the boy getting taller and his weight increased realistic at the same time. There wasn't a lot of changed in height and weight, the average height of the boy which is 68.403, compared to the median height of the boy which is 68.245, the differences between these two numbers are not much, which is normal. The average weight isW2: Visualizing and Interpreting Data Using the skills you learned in weeks 1 and 2 eyaluate a set of statistics. An Excel spreadsheet is attached including 30 data sets representing the height and weight of 10 year old boys. The first column is the height in inches and the second the weight in pounds. Choose one data set that has not already been selected {include the number of the data set in your title to make this easier to do]. Calculate the mean, median and mode of the weights in the data set. You can either do this by hand or see the yideo below to show you how to do this using the tools in Excel. Then, explain what these numbers mean. Are they the same? Why are they different? Then. construct a scatter plot. - From the insert menu select scatter or the chart that says scatter and then select the chart at the top left on the dropdown - Click on one of the points - Select Add Trendline {Note you may need to add Trendline and then click on the line to format Trendline} W2: Visualizing and Interpreting Data . The default radio button is linear, keep it checked What are your observations from the scatter plot? Does it appear that there is a correlation between the height and weight of 10 yr old boys. Note: this data is made up, so do you think this is accurate? Do you think given real data that there would be a greater amount of correlation or less? If you have a different version of excel then you may want to search to see how to form a trendline. These instructions work with Office 365 and Office 2010. . Attach your excel worksheet with your scatter plot . For the title of your post use your last name and the data set that you selected (Example: Smith - Data Set #51). . Be sure to comment on at least 2 classmates. You could discuss other times that this visualization would be useful? Or what other visualizations could be useful in this scenario? How do you choose
Step by Step Solution
There are 3 Steps involved in it
Step: 1
Get Instant Access to Expert-Tailored Solutions
See step-by-step solutions with expert insights and AI powered tools for academic success
Step: 2
Step: 3
Ace Your Homework with AI
Get the answers you need in no time with our AI-driven, step-by-step assistance