

Question
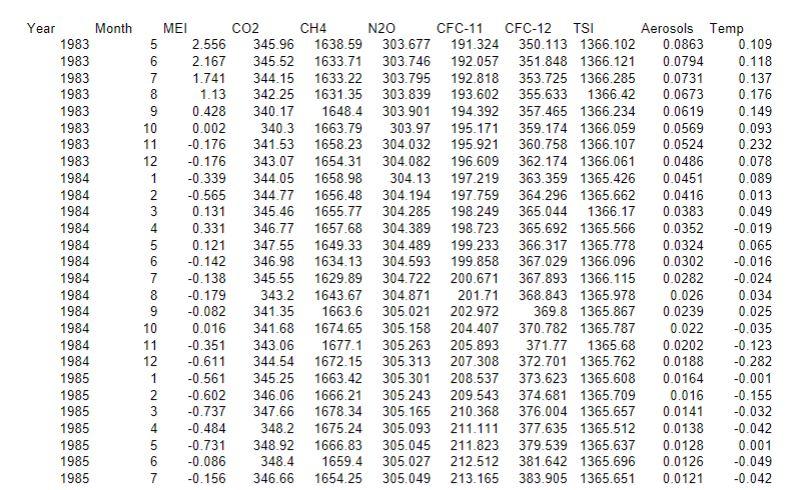
Data Set Code: Year Month MEI CO2 CH4 N2O CFC-11 CFC-12 TSI Aerosols Temp 1983 5 2.556 345.96 1638.59 303.677 191.324 350.113 1366.102 0.0863 0.109
Data Set Code:
Year Month MEI CO2 CH4 N2O CFC-11 CFC-12 TSI Aerosols Temp 1983 5 2.556 345.96 1638.59 303.677 191.324 350.113 1366.102 0.0863 0.109 1983 6 2.167 345.52 1633.71 303.746 192.057 351.848 1366.121 0.0794 0.118 1983 7 1.741 344.15 1633.22 303.795 192.818 353.725 1366.285 0.0731 0.137 1983 8 1.13 342.25 1631.35 303.839 193.602 355.633 1366.42 0.0673 0.176 1983 9 0.428 340.17 1648.4 303.901 194.392 357.465 1366.234 0.0619 0.149 1983 10 0.002 340.3 1663.79 303.97 195.171 359.174 1366.059 0.0569 0.093 1983 11 -0.176 341.53 1658.23 304.032 195.921 360.758 1366.107 0.0524 0.232 1983 12 -0.176 343.07 1654.31 304.082 196.609 362.174 1366.061 0.0486 0.078 1984 1 -0.339 344.05 1658.98 304.13 197.219 363.359 1365.426 0.0451 0.089 1984 2 -0.565 344.77 1656.48 304.194 197.759 364.296 1365.662 0.0416 0.013 1984 3 0.131 345.46 1655.77 304.285 198.249 365.044 1366.17 0.0383 0.049 1984 4 0.331 346.77 1657.68 304.389 198.723 365.692 1365.566 0.0352 -0.019 1984 5 0.121 347.55 1649.33 304.489 199.233 366.317 1365.778 0.0324 0.065 1984 6 -0.142 346.98 1634.13 304.593 199.858 367.029 1366.096 0.0302 -0.016 1984 7 -0.138 345.55 1629.89 304.722 200.671 367.893 1366.115 0.0282 -0.024 1984 8 -0.179 343.2 1643.67 304.871 201.71 368.843 1365.978 0.026 0.034 1984 9 -0.082 341.35 1663.6 305.021 202.972 369.8 1365.867 0.0239 0.025 1984 10 0.016 341.68 1674.65 305.158 204.407 370.782 1365.787 0.022 -0.035 1984 11 -0.351 343.06 1677.1 305.263 205.893 371.77 1365.68 0.0202 -0.123 1984 12 -0.611 344.54 1672.15 305.313 207.308 372.701 1365.762 0.0188 -0.282 1985 1 -0.561 345.25 1663.42 305.301 208.537 373.623 1365.608 0.0164 -0.001 1985 2 -0.602 346.06 1666.21 305.243 209.543 374.681 1365.709 0.016 -0.155
Please write a R script for EACH VARIABLE
Will Upvote, Thank you!
4. Plot the data over 5 year intervals eg. 19831987,19881992,19931997,1998 2002, 2003 - 2008, averaging our the values over the period. 5. Identify any outliers in the data. If any are found, apply appropriate transformation to the dataset. 6. Create a Linear Regression Model for the different variables. Identify the following: (a) sample minimum (smallest observation), (b) lower quartile or first quartile (Q1). (c) median (the middle value), (d) upper quartile or third quartile (Q3), (e) sample maximum (largest observation). 7. Give the linear regression model equation from the data for the different variablesStep by Step Solution
There are 3 Steps involved in it
Step: 1

Get Instant Access to Expert-Tailored Solutions
See step-by-step solutions with expert insights and AI powered tools for academic success
Step: 2

Step: 3
Ace Your Homework with AI
Get the answers you need in no time with our AI-driven, step-by-step assistance
Get Started
Beginning PostgreSQL On The Cloud Simplifying Database As A Service On Cloud Platforms
Authors: Baji Shaik ,Avinash Vallarapu
1st Edition
1484234464, 978-1484234464