Answered step by step
Verified Expert Solution
Question
1 Approved Answer
data set is large name of dataset is delaney-processed.csv please provide code for all parts thank you!! dataset cannot be attached because too large, i


data set is large
name of dataset is delaney-processed.csv
please provide code for all parts thank you!!
dataset cannot be attached because too large, i can send link via another platform!
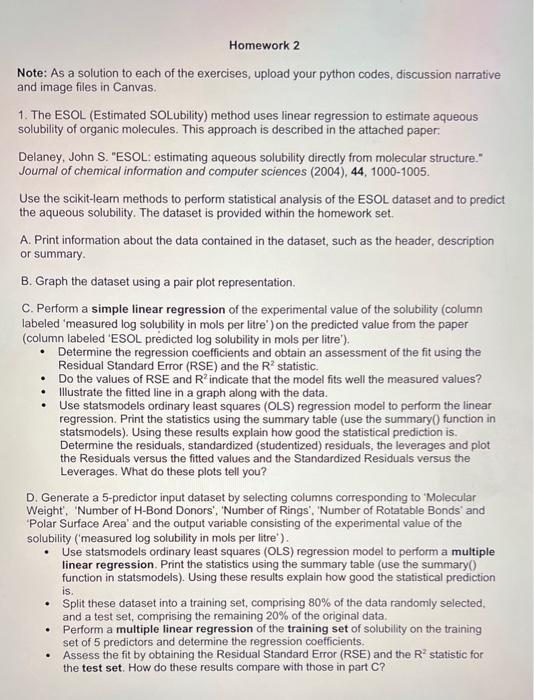
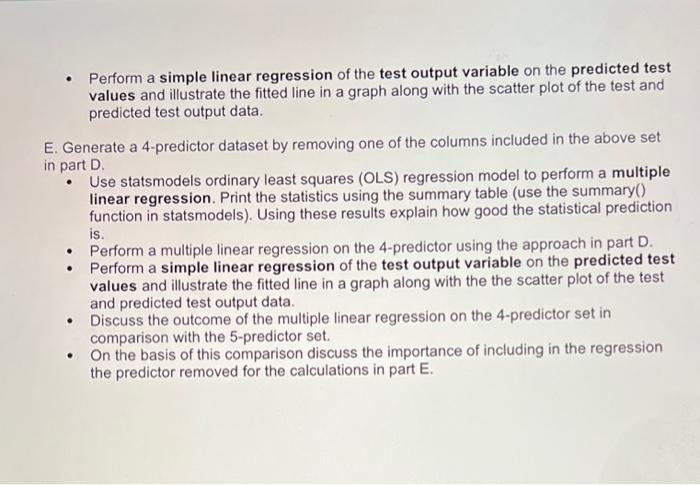
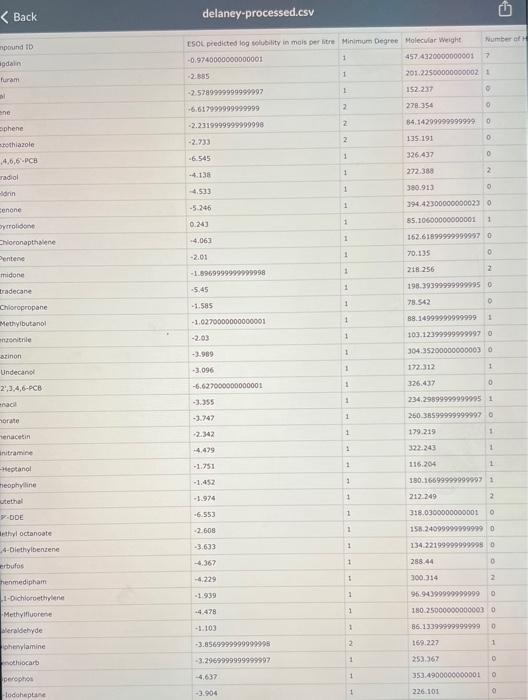
C. Perform a simple linear regression of the experimental value of the solubility (column labeled 'measured log solubility in mols per litre') on the predicted value from the paper (column labeled 'ESOL prdicted log solubility in mols per litre'). - Determine the regression coefficients and obtain an assessment of the fit using the Residual Standard Error (RSE) and the R2 statistic. - Do the values of RSE and R2 indicate that the model fits well the measured values? - Illustrate the fitted line in a graph along with the data. - Use statsmodels ordinary least squares (OLS) regression model to perform the linear regression. Print the statistics using the summary table (use the summary() function in statsmodels). Using these results explain how good the statistical prediction is. Determine the residuals, standardized (studentized) residuals, the leverages and plot the Residuals versus the fitted values and the Standardized Residuals versus the Leverages. What do these plots tell you? D. Generate a 5-predictor input dataset by selecting columns corresponding to 'Molecular Weight', 'Number of H-Bond Donors', 'Number of Rings', 'Number of Rotatable Bonds' and 'Polar Surface Area' and the output variable consisting of the experimental value of the solubility ('measured log solubility in mols per litre'). - Use statsmodels ordinary least squares (OLS) regression model to perform a multiple linear regression. Print the statistics using the summary table (use the summary() function in statsmodels). Using these results explain how good the statistical prediction is. - Split these dataset into a training set, comprising 80% of the data randomly selected, and a test set, comprising the remaining 20% of the original data. - Perform a multiple linear regression of the training set of solubility on the training set of 5 predictors and determine the regression coefficients. - Assess the fit by obtaining the Residual Standard Error (RSE) and the R2 statistic for the test set. How do these results compare with those in part C? - Perform a simple linear regression of the test output variable on the predicted test values and illustrate the fitted line in a graph along with the scatter plot of the test and predicted test output data. E. Generate a 4-predictor dataset by removing one of the columns included in the above set in part D. - Use statsmodels ordinary least squares (OLS) regression model to perform a multiple linear regression. Print the statistics using the summary table (use the summary() function in statsmodels). Using these results explain how good the statistical prediction is. - Perform a multiple linear regression on the 4-predictor using the approach in part D. - Perform a simple linear regression of the test output variable on the predicted test values and illustrate the fitted line in a graph along with the the scatter plot of the test and predicted test output data. - Discuss the outcome of the multiple linear regression on the 4-predictor set in comparison with the 5-predictor set. - On the basis of this comparison discuss the importance of including in the regression the predictor removed for the calculations in part E. delaney-processed.csv Back Ct predicted log velubility in mas per iton Minimum Degree Molecular Weight dataset name is included. If dataset dannot be reached maybe type code and pretend dataset is provided.
thank you
Step by Step Solution
There are 3 Steps involved in it
Step: 1

Get Instant Access to Expert-Tailored Solutions
See step-by-step solutions with expert insights and AI powered tools for academic success
Step: 2

Step: 3

Ace Your Homework with AI
Get the answers you need in no time with our AI-driven, step-by-step assistance
Get Started


