Question: Data Subgroup Pipe 1 Pipe 2 Pipe 3 Pipe 4 Pipe 5 Pipe 6 X-bar 2.94 2.97 R 3.0 2.98 2.96 2.94 2.96 2.96 2.97
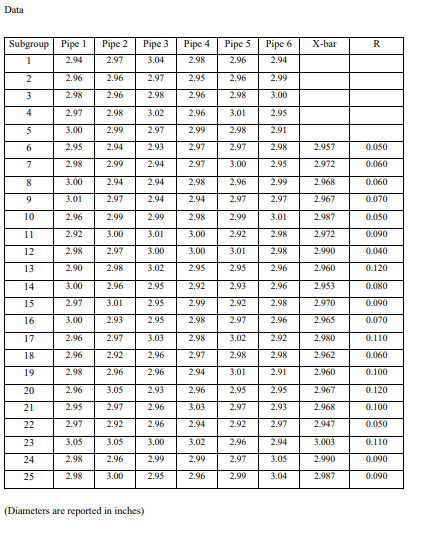
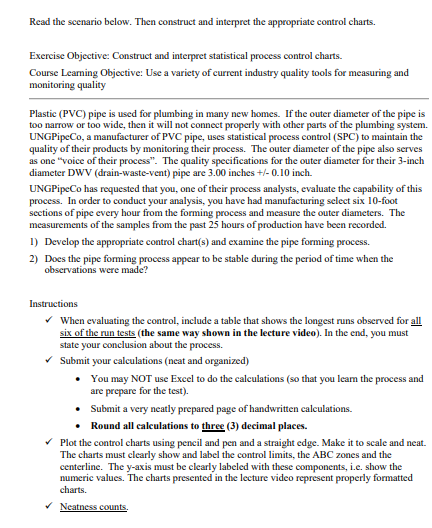
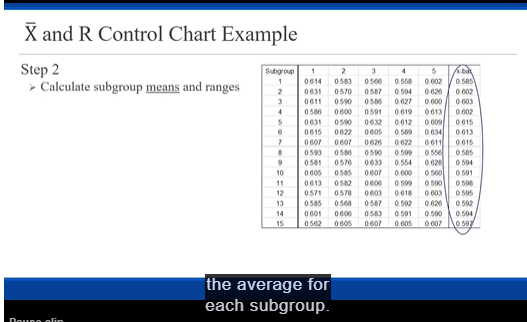
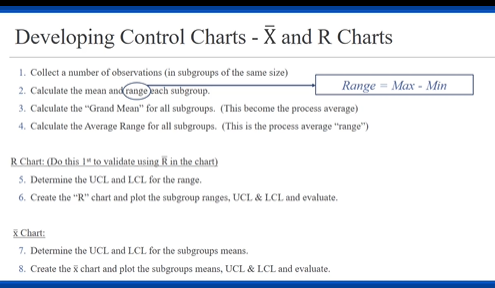
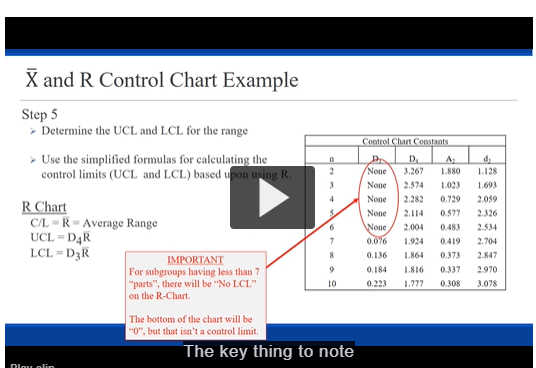
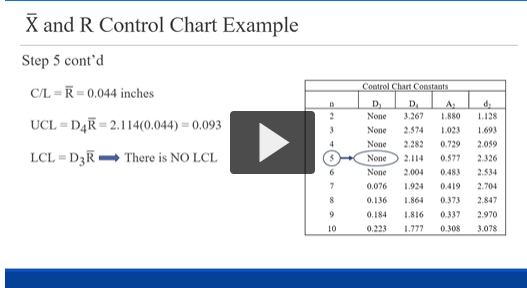
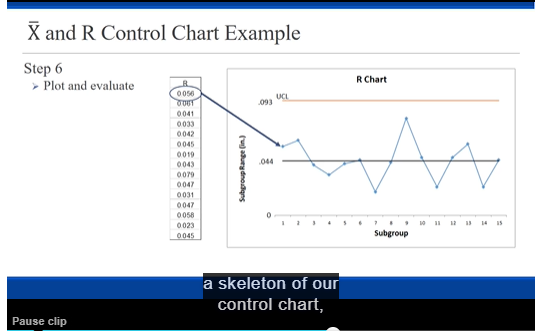
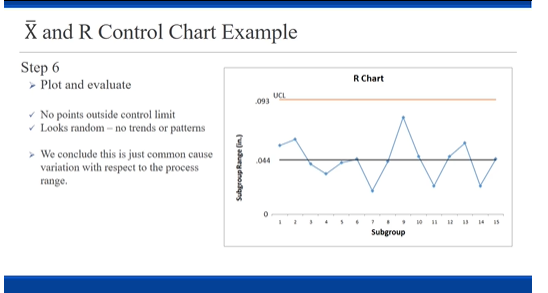
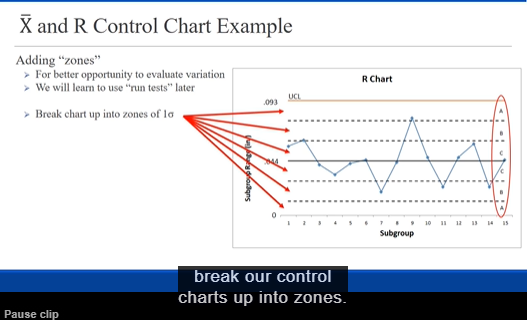
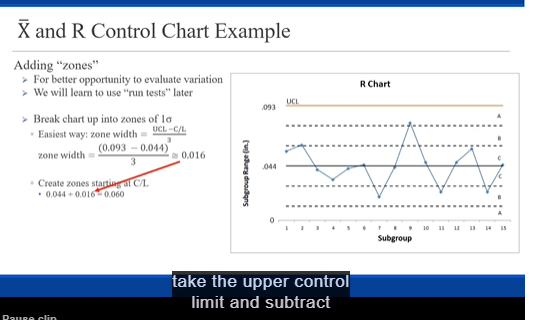
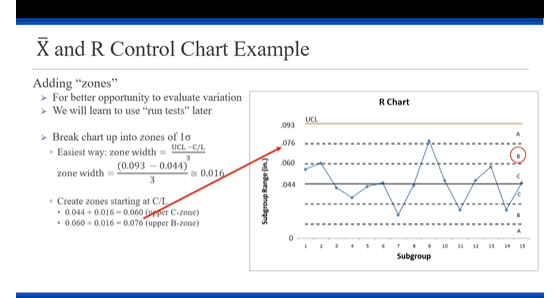
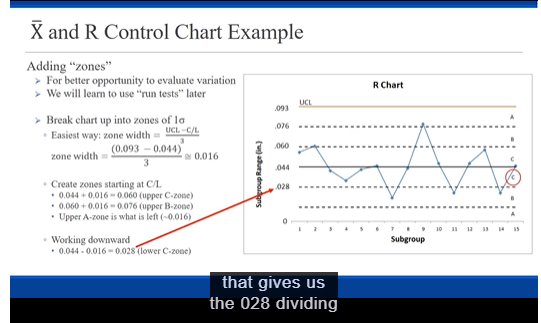
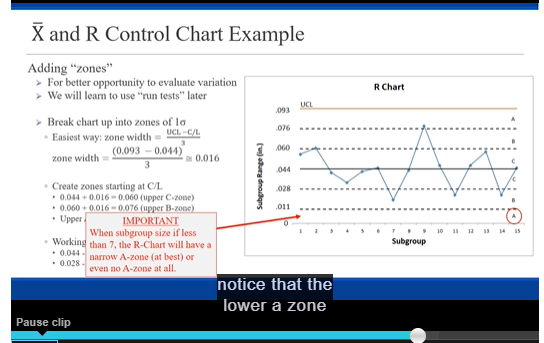
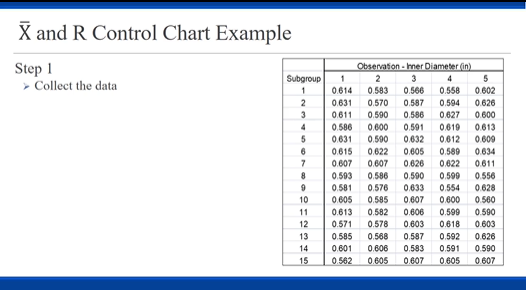
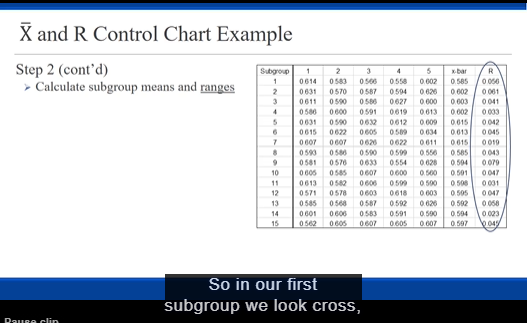
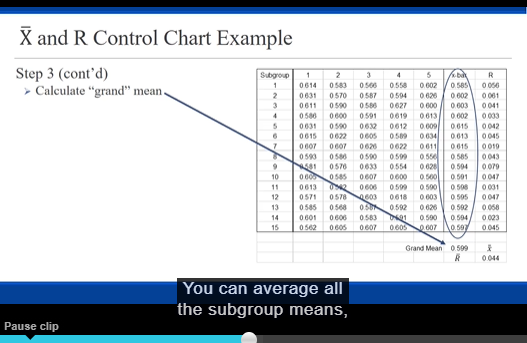
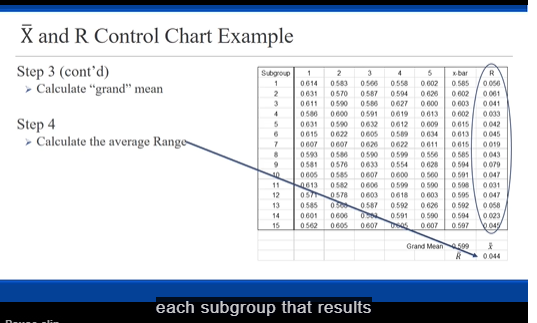
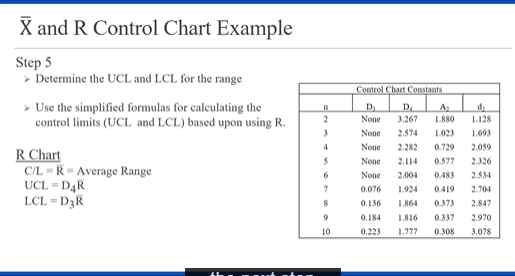
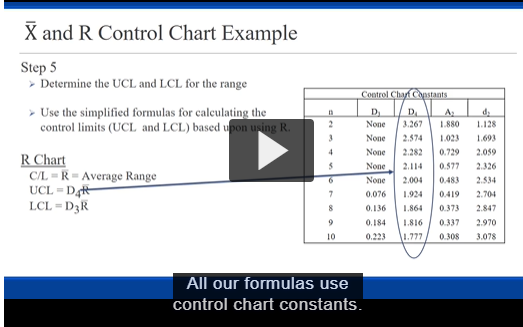
Data Subgroup Pipe 1 Pipe 2 Pipe 3 Pipe 4 Pipe 5 Pipe 6 X-bar 2.94 2.97 R 3.0 2.98 2.96 2.94 2.96 2.96 2.97 2.95 2.96 2.99 2.98 2.96 2.98 2.96 2.98 3.00 2.97 2.98 3.02 2.96 3.01 2.95 3.00 2.90 2.97 2.94 2.98 2.91 6 2.95 2.94 2.93 2.97 2.97 2.98 2.957 sJ 2.98 2.99 2.94 2.97 3.00 2.95 2.972 8 3.00 12060 2.94 2.94 2.98 2.96 2.99 g 2.968 3.01 02060 2.97 2.94 2.94 2.97 2.97 10 2.967 2.96 1070 2.99 2.99 2.98 2.90 3.01 11 2.987 2.92 3.00 3.01 3.00 2.92 2.98 12 2.972 2.98 12090 2.97 3.00 3.00 3.01 2.98 13 2.990 2.90 02040 2.98 3.02 2.95 2.95 2.96 2.960 14 3.00 0.120 2.96 2.95 2.92 2.93 2.96 15 2.953 2.97 ITOSO 3.01 2.95 2.90 2.92 2.98 16 2.970 3.00 12090 2.93 2.9: 2.98 2.97 2.96 2.965 17 2.96 12070 2.97 3.0 2.98 3.02 2.91 2.980 2.96 0.110 2.92 2.96 2.97 2.98 2.98 19 2.962 2.98 17060 2.96 2.96 2.94 3.01 2.91 2.960 20 2.96 0.100 3.05 2.93 2.96 2.95 2.95 21 2.967 2.95 2.97 0.120 2.96 3.03 2.97 2.93 22 2.968 2.97 0.100 2.92 2.96 2.94 2.92 2.97 23 2.947 ITOSO 3.05 3.05 3.00 3.02 2.96 2.94 3.003 24 2.98 0.110 2.96 2.99 2.94 2.97 3.05 25 2.990 2.98 12090 3.00 2.9: 2.96 2.99 3.04 2.987 0.090 (Diameters are reported in inches)Read the scenario below. Then construct and interpret the appropriate control charts. Exercise Objective: Construct and interpret statistical process control charts. Course Learning Objective: Use a variety of current industry quality tools for measuring and monitoring quality Plastic (PVC) pipe is used for plumbing in many new homes. If the outer diameter of the pipe is too narrow or too wide, then it will not connect properly with other parts of the plumbing system. UNGPipeCo, a manufacturer of PVC pipe, uses statistical process control (SPC) to maintain the quality of their products by monitoring their process. The outer diameter of the pipe also serves as one "voice of their process". The quality specifications for the outer diameter for their 3-inch diameter DWV (drain-waste-vent) pipe are 3.00 inches +/- 0.10 inch. UNGPipeCo has requested that you, one of their process analysts, evaluate the capability of this process. In order to conduct your analysis, you have had manufacturing select six 10-foot sections of pipe every hour from the forming process and measure the outer diameters. The measurements of the samples from the past 25 hours of production have been recorded. I) Develop the appropriate control chart(s) and examine the pipe forming process. 2) Does the pipe forming process appear to be stable during the period of time when the observations were made? Instructions When evaluating the control, include a table that shows the longest runs observed for all six of the run tests (the same way shown in the lecture video). In the end, you must state your conclusion about the process. Submit your calculations (neat and organized) . You may NOT use Excel to do the calculations (so that you learn the process and are prepare for the test). Submit a very neatly prepared page of handwritten calculations. Round all calculations to three (3) decimal places. " Plot the control charts using pencil and pen and a straight edge. Make it to scale and neat. The charts must clearly show and label the control limits, the ABC zones and the centerline. The y-axis must be clearly labeled with these components, i.e. show the numeric values. The charts presented in the lecture video represent properly formatted charts. Neatness counts.\fDeveloping Control Charts - X and R Charts I. Collect a number of observations (in subgroups of the same size) 2. Calculate the mean and range each subgroup. Range = Max - Min 3. Calculate the "Grand Mean" for all subgroups. (This become the process average) 4. Calculate the Average Range for all subgroups. (This is the process average "range") R Chart: (Do this I' to validate using R in the chart ) 5. Determine the UCL and LCL for the range. 6. Create the "R" chart and plot the subgroup ranges, UCL & LCL and evaluate. X Chart: 7. Determine the UCL and LCL for the subgroups means. 8. Create the X chart and plot the subgroups means, UCL & LCL and evaluate.X and R Control Chart Example Step 5 Determine the UCL and LCL for the range Control Chart Constants Use the simplified formulas for calculating the D control limits (UCL and LCL) based upon using R. None 3.267 1 880 1.128 None 1.023 1.691 R Chart None 0.729 2.059 None 2.114 0.577 2.326 C/L - R = Average Range None 2.004 0.483 2.534 UCL = DAR F 0,076 1.924 0.419 2.704 LCL = DAR IMPORTANT 0.136 1.864 0.373 2.847 For subgroups having less than 7 0,184 1.816 0.337 2.970 "parts", there will be "No LCL" 0,123 1.777 0 308 3.078 on the R-Chart. The bottom of the chart will be "0", but that isn't a control limit. The key thing to note\fX and R Control Chart Example Step 6 > Plot and evaluate A Chart 0 050 UCL 093 0 041 0 033 0 042 0 045 0043 044 Subgroup Range [in ] OOTO 0 031 DO47 0 056 0 021 0 045 Subgroup a skeleton of our control chart, Pause clipX and R Control Chart Example Step 6 R Chart Plot and evaluate UCL 093 No points outside control limit Looks random - no trends or patterns We conclude this is just common cause 044 variation with respect to the process Subgroup Range [in ) range. SubgroupX and R Control Chart Example Adding "zones" >For better opportunity to evaluate variation R Chart >We will learn to use "run tests" later LICI .093 > Break chart up into zones of la 10 Subgroup break our control charts up into zones. Pause clipX and R Control Chart Example Adding "zones" For better opportunity to evaluate variation R Chart > We will learn to use "run tests" later LICI EGO' Break chart up into zones of la . Easiest way: zone width = UCL -C/L (0.093 - 0.044) zone width = NO.016 3 044 Subgroup Range [in ] . Create zones starting In C/L * 0.044 + 0.016 0.060 10 Subgroup take the upper control limit and subtractX and R Control Chart Example Adding "zones" >For better opportunity to evaluate variation R Chart We will learn to use "run tests" later LICI Break chart up into zones of la . Easiest way: zone width = UCL -C/L (0.093 - 0.044) zone width = 0.016. 3 044 Subgroup Range (in ) Create zones starting at C/I * 0.044 + 0.016 - 0.060 [upper C-zone) : 0.060 + 0.016 - 0.076 (upper B-zonc) IN 10 SubgroupX and R Control Chart Example Adding "zones" For better opportunity to evaluate variation R Chart We will learn to use "run tests" later LICI EGO > Break chart up into zones of la . Easiest way: zone width = UCL -C/L (0.093 - 0.044) zone width = 0.016 3 044 Subgroup Range [in ] . Create zones starting at C/L. * 0.044 + 0.016 = 0.060 (upper C-zone) * 0.060 + 0.016 = 0.076 (upper B-zone) . Upper A-zone is what is left (-0.016) T 10 . Working downward Subgroup * 0.044 - 0.016 - 0.028 (lower C-zone) that gives us the 028 dividingX and R Control Chart Example Adding "zones" For better opportunity to evaluate variation R Chart >We will learn to use "run tests" later UCL Break chart up into zones of la . Easiest way: zone width = UCL -C/L (0.093 - 0.014) zone width = 0.016 3 044 Subgroup Range [in ) Create zones starting at C/L 028 * 0.044 + 0.016 = 0.060 (upper C-zone) . 0.060 + 0.016 - 0.076 (upper B-zone) . Upper IMPORTANT When subgroup size if less T 10 . Working than 7, the R-Chart will have a Subgroup . 0.044 - . 0.028 - narrow A-zone (at best) or even no A-zone at all. notice that the lower a zone Pause clipX and R Control Chart Example Step 1 Observation - ner Diameter in Collect the data Subgroup 1 2 3 0.614 0.593 0.566 0.558 0.602 0.631 0.570 0.587 0.594 0.626 0.611 0.590 0.586 0.627 0.600 0.586 0.600 0,591 0.019 0.613 0.631 0.590 0.632 0.612 0.609 0.015 0.022 0.605 0.589 0.834 0.007 0.607 0.020 0.022 0811 0.503 0.580 0.590 0.509 0.556 0.581 0.576 0.033 0.554 0.628 10 0.605 0.585 0.607 0.600 0.500 11 0.613 0.582 0.606 0.598 0.580 12 0.571 0.578 0.603 0.618 0.603 13 0.585 0.568 0.587 0.592 0.626 14 0.601 0.606 0.583 0.591 0.590 15 0.562 0.605 0.607 0.605 0.607X and R Control Chart Example Step 2 (cont'd) Subgroup 1 2 15 Calculate subgroup means and ranges 1 0614 0550 0.602 0.58 0 036 0 031 0570 0587 0504 0 007 0 011 0540 0027 0 000 0 003 0 011 0540 0591 0 019 0.013 0.002 0631 0632 0612 0.609 0.015 0 042 0 015 0622 0.634 0.013 0 045 0627 0611 0 015 0.585 0841 0.804 10 0 806 0 907 0.500 0.501 11 0613 0.500 0.508 0 031 12 0571 0578 0618 0603 0.505 0 545 0 548 0.502 0.542 0801 0 583 0591 0.500 0.504 0.023 0.607 0.897 So in our first subgroup we look cross,\fX and R Control Chart Example Step 3 (cont'd) Subgroup 1 2 5 0614 0.602 0.585 Calculate "grand" mean 0831 0570 0 587 0504 0 007 0 011 0 590 0 027 0 000 0 003 0 041 0504 0591 0619 0.013 0 602 Step 4 0631 0612 0.615 0 042 0015 0622 0634 0.013 0 045 Calculate the average Range 0627 0611 0615 0 010 0.804 0.501 11 0.500 12 0 505 0.592 0.628 0.542 14 0801 0591 0.500 0.504 0 023 0862 01 07 0.607 0.897 Grand Mean Ly 0.044 each subgroup that resultsX and R Control Chart Example Step 5 Determine the UCL and LCL for the range Control Chart Constants Use the simplified formulas for calculating the D control limits (UCL and LCL) based upon using R. None 1.267 1 880 None 2.574 1.021 1.693 None 0.729 2.059 R. Chart None 0.577 2.326 C/L - R - Average Range None 2.004 0.183 2.434 UCL = DAR 0.076 1.924 0.419 2.704 LCL = DqR 0.136 1.864 0 373 2.847 0, 184 1.816 0 137 2.970 0,224 1.777 0 308 3.078X and R Control Chart Example Step 5 Determine the UCL and LCL for the range Control Chart Constants Use the simplified formulas for calculating the D D control limits (UCL and LCL) based upon using R. None 3.267 1 880 1.128 None 2.574 1.021 1.693 R Chart None 0.729 2.059 None 3.114 0.$77 2.326 C/L - R = Average Range None 2.004 0483 2.$34 UCL = D.R 0.076 1.924 0.419 2.704 LCL = DAR 0.136 1.864 0.373 2.847 9 0, 184 1.816 0337 2.970 10 0,224 1.777 0 308 3.078 All our formulas use control chart constants
Step by Step Solution
There are 3 Steps involved in it

Get step-by-step solutions from verified subject matter experts


