

Answered step by step
Verified Expert Solution
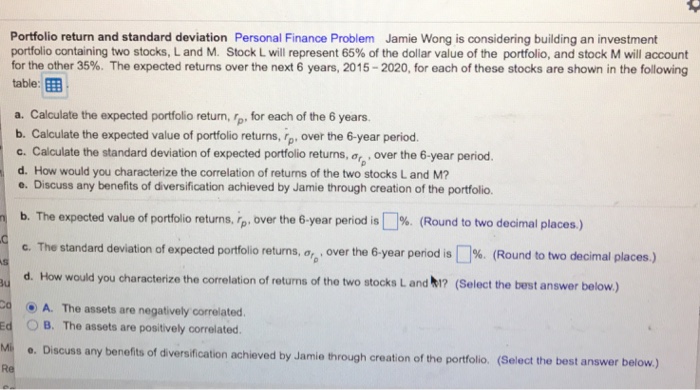
Question
1 Approved Answer
Data Table (click on the icon located on the top-right corner of the data table below in order to copy its contents into a spreadsheet.)
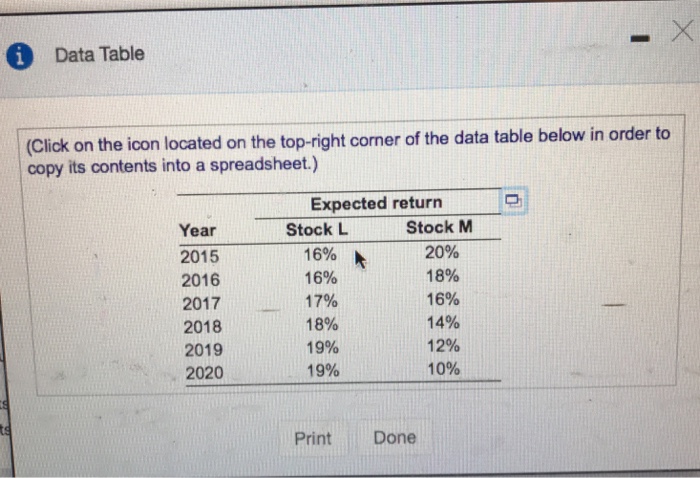
 Data Table (click on the icon located on the top-right corner of the data table below in order to copy its contents into a spreadsheet.) Expected return Stock M Stock L Year 20% 16% 2015 16% 18% 2016 16% 17% 2017 14% 18% 2018 19% 12% 2019 10% 19% 2020 Print Done
Step by Step Solution
There are 3 Steps involved in it
Step: 1

Get Instant Access to Expert-Tailored Solutions
See step-by-step solutions with expert insights and AI powered tools for academic success
Step: 2

Step: 3
Ace Your Homework with AI
Get the answers you need in no time with our AI-driven, step-by-step assistance
Get Started
Quantitative Analysis For Management
Authors: Barry Render, Ralph M. Stair, Michael E. Hanna, Trevor S. Hale
14th Edition