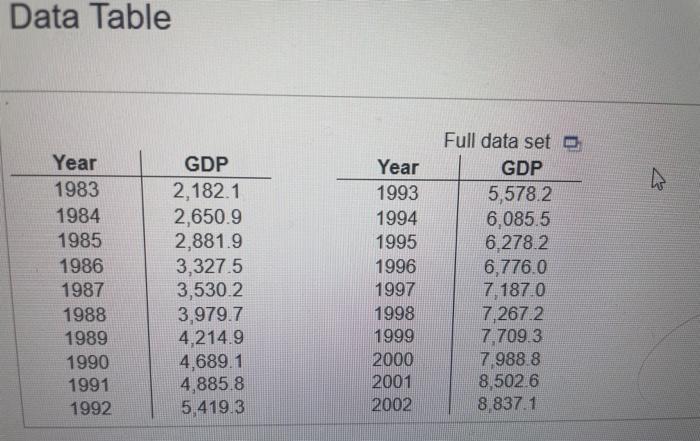
Data Table Full data set Year GDP Year GDP 1983 2,182.1 1993 5,578.2 1984 2,650.9 1994 6,085.5 1985 2,881.9 1995 6,278.2 1986 3,327.5 1996


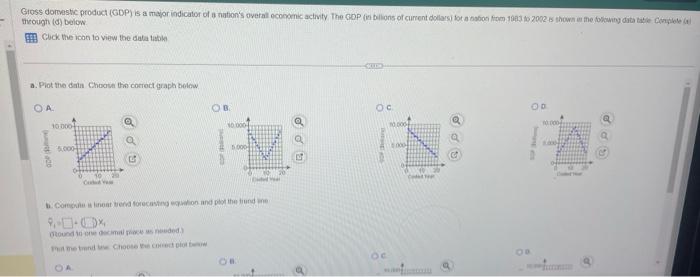
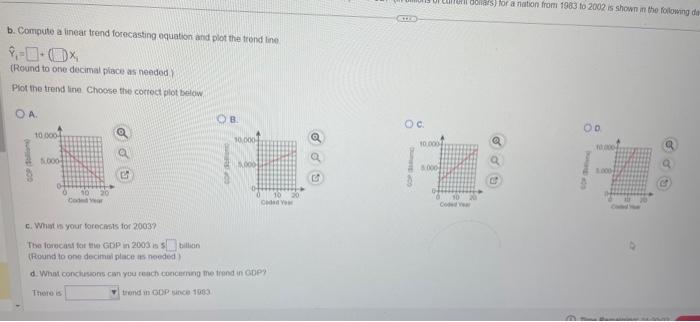
Data Table Full data set Year GDP Year GDP 1983 2,182.1 1993 5,578.2 1984 2,650.9 1994 6,085.5 1985 2,881.9 1995 6,278.2 1986 3,327.5 1996 6,776.0 1987 3,530.2 1997 7,187.0 1988 3,979.7 1998 7,267.2 1989 4,214.9 1999 7,709.3 1990 4,689.1 2000 7,988.8 1991 4,885.8 2001 8,502.6 1992 5,419.3 2002 8,837.1 Gross domestic product (GDP) is a major indicator of a nation's overall economic activity. The GDP (in billions of current dollars) for a nation from 1983 to 2002 is shown in the following data table Complete through (d) below Click the icon to view the data table a. Piot the data Choose the correct graph below OA D 10.000 5,000 C Oc 10.000 100062 5000 b. Compute a linear trend forecasting equation and pilot the trend ane 9-0-0x ound to one decimal place as needed.) Put the trend le Choose the correct plot bow OC 000 APP 00 10.000- d 990 b. Compute a linear trend forecasting equation and plot the trend line. -0-0x (Round to one decimal place as needed.) Plot the trend line Choose the correct plot below OA. 10 000 OB 10.000 5,000 5,000 10 Codel Year c. What is your forecasts for 2003? The forecast for the GDP in 2003 in billion (Round to one decimal place as needed) d. What conclusions can you reach concerning the trend in GDP There is trend in ODP since 1983 10 20 C 10.000 5.000 Cum dollars) for a nation from 1983 to 2002 is shown in the following da Coded Year 10000 1000
Step by Step Solution
There are 3 Steps involved in it
Step: 1

See step-by-step solutions with expert insights and AI powered tools for academic success
Step: 2

Step: 3

Ace Your Homework with AI
Get the answers you need in no time with our AI-driven, step-by-step assistance
Get Started


