Answered step by step
Verified Expert Solution
Question
1 Approved Answer
Data Table Mitchell Music Co. Comparative Income Statements Years Ended December 31, 2018 and 2017 2018 2017 Total revenue $ 836,000 $ 938,000 Expenses: Cost
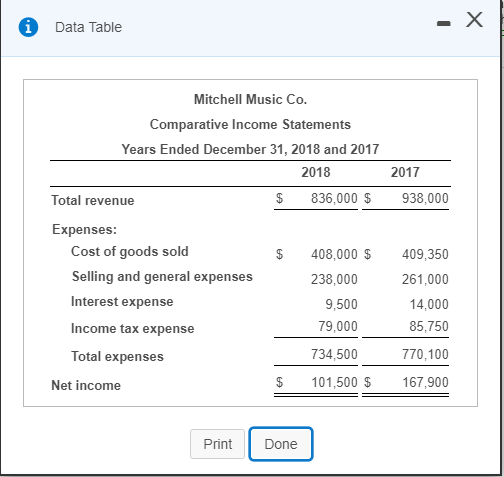
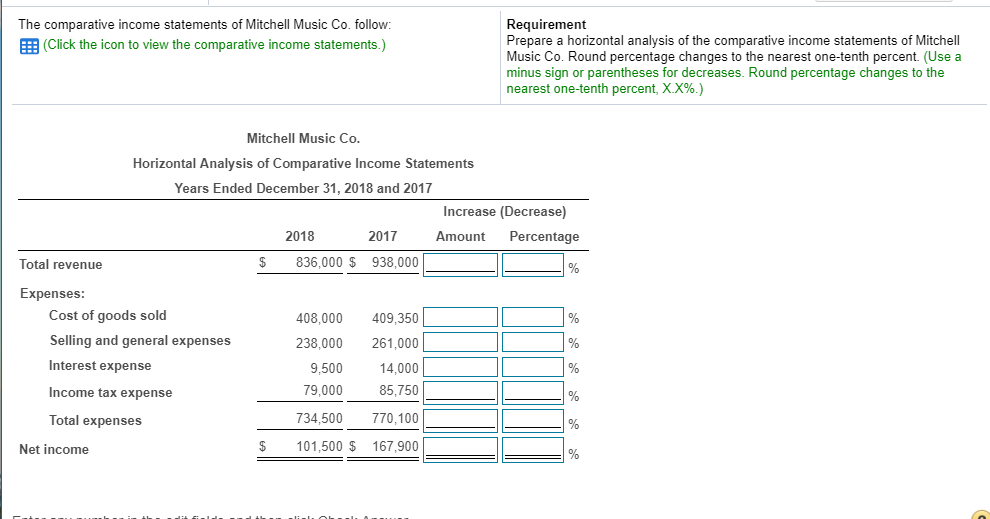
Data Table Mitchell Music Co. Comparative Income Statements Years Ended December 31, 2018 and 2017 2018 2017 Total revenue $ 836,000 $ 938,000 Expenses: Cost of goods sold Selling and general expenses Interest expense Income tax expense Total expenses $408,000 $ 409,350 261,000 14,000 85,750 770,100 $ 101,500 167,900 238,000 9,500 79,000 734,500 Net income Print Done The comparative income statements of Mitchell Music Co. follow: EE (click the icon to view the comparative income statements.) Requirement Prepare a horizontal analysis of the comparative income statements of Mitchell Music Co. Round percentage changes to the nearest one-tenth percent. (Use a minus sign or parentheses for decreases. Round percentage changes to the nearest one-tenth percent, XX%.) Mitchell Music Co. Horizontal Analysis of Comparative Income Statements Years Ended December 31, 2018 and 2017 Increase (Decrease) Amount Percentage 2018 2017 Total revenue $ 836,000 $ 938,000 Expenses: Cost of goods sold Selling and general expenses Interest expense Income tax expense Total expenses 408,000 409,350 238,000 261,000 14,000 85,750 734,500 770.100 $ 101,500 167,900 9,500 79,000 Net income
Step by Step Solution
There are 3 Steps involved in it
Step: 1
Get Instant Access to Expert-Tailored Solutions
See step-by-step solutions with expert insights and AI powered tools for academic success
Step: 2
Step: 3
Ace Your Homework with AI
Get the answers you need in no time with our AI-driven, step-by-step assistance
Get Started