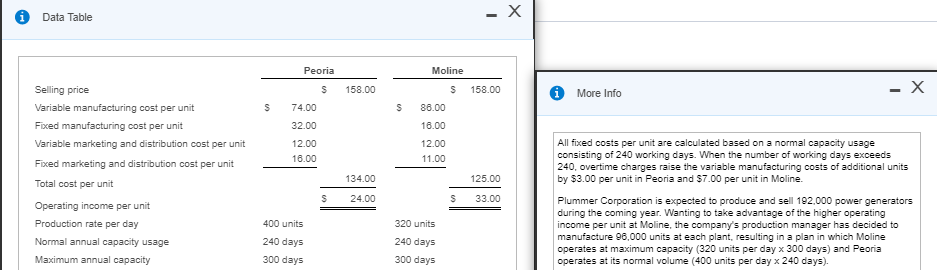
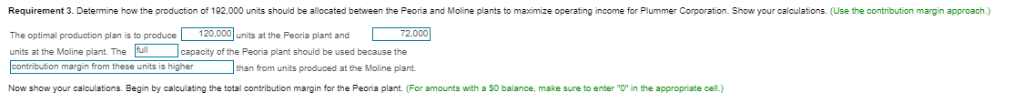
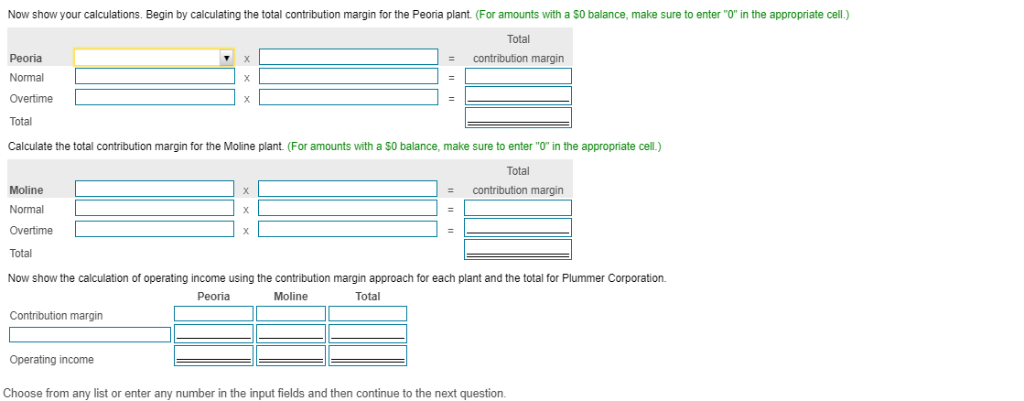
Data Table Peoria Moline Selling price Variable manufacturing cost per unit Fixed manufacturing cost per unit Variable marketing and distribution cost per unit Fixed marketing and distribution cost per unit Total cost per unit Operating income per unit Production rate per day Normal annual capacity usage Maximum annual capacity S 158.00 S 158.00 More Info S 74.00 32.00 12.00 16.00 S 86.00 16.00 12.00 11.00 All fixed costs per unit are calculated based on a normal capacity usage consisting of 240 working days. When the number of working days exceeds 240, overtime charges raise the variable manufacturing costs of additional units 134.00 125.00 by $3.00 per unit in Peoria and $7.00 per unit in Moline. 24.00 S 33.00 400 units 240 days 300 days 320 units 240 days 300 days Plummer Corporation is expected to produce and sell 192,000 powergenerators during the coming year. Wanting to take advantage of the higher operating income per unit at Moline, the company's production manager has decided to manufacture 96,000 units at each plant, resulting in a plan in which Moline operates at maximum capacity (320 units per day x 300 days) and Peoria operates at its nomal volume (400 units per day x 240 days). Requirement 3. Determine how the production of 192.000 units should be allocated between the Peoria and Moline plants to maximize operating income for Plummer Corporation. Show your calculations. (Use the contribution margin approach.) The optimal production plan is to produce 120.000 units at the Peoria plant and units at the Moline plant. The capacity of the Peoria plant should be used because the on margin from these units is higher han from units produced at the Moline plant. Now show your calculations. Begin by calculating the total contribution margin for the Peoria plant. (For amounts with a $0 balance, make sure to enter "O' in the appropriate cell.) Now show your calculations. Begin by calculating the total contribution margin for the Peoria plant. (For amounts with a $0 balance, make sure to enter "O" in the appropriate cell.) Total Peoria Normal Overtime Total Calculate the total contribution margin for the Moline plant. (For amounts with a $0 balance, make sure to enter "O" in the appropriate cell.) - contribution margin Total Moline Normal Overtime Total Now show the calculation of operating income using the contribution margin approach for each plant and the total for Plummer Corporation. contribution margin Peoria Moline Total Contribution margin Operating income Choose from any list or enter any number in the input fields and then continue to the next question Data Table Peoria Moline Selling price Variable manufacturing cost per unit Fixed manufacturing cost per unit Variable marketing and distribution cost per unit Fixed marketing and distribution cost per unit Total cost per unit Operating income per unit Production rate per day Normal annual capacity usage Maximum annual capacity S 158.00 S 158.00 More Info S 74.00 32.00 12.00 16.00 S 86.00 16.00 12.00 11.00 All fixed costs per unit are calculated based on a normal capacity usage consisting of 240 working days. When the number of working days exceeds 240, overtime charges raise the variable manufacturing costs of additional units 134.00 125.00 by $3.00 per unit in Peoria and $7.00 per unit in Moline. 24.00 S 33.00 400 units 240 days 300 days 320 units 240 days 300 days Plummer Corporation is expected to produce and sell 192,000 powergenerators during the coming year. Wanting to take advantage of the higher operating income per unit at Moline, the company's production manager has decided to manufacture 96,000 units at each plant, resulting in a plan in which Moline operates at maximum capacity (320 units per day x 300 days) and Peoria operates at its nomal volume (400 units per day x 240 days). Requirement 3. Determine how the production of 192.000 units should be allocated between the Peoria and Moline plants to maximize operating income for Plummer Corporation. Show your calculations. (Use the contribution margin approach.) The optimal production plan is to produce 120.000 units at the Peoria plant and units at the Moline plant. The capacity of the Peoria plant should be used because the on margin from these units is higher han from units produced at the Moline plant. Now show your calculations. Begin by calculating the total contribution margin for the Peoria plant. (For amounts with a $0 balance, make sure to enter "O' in the appropriate cell.) Now show your calculations. Begin by calculating the total contribution margin for the Peoria plant. (For amounts with a $0 balance, make sure to enter "O" in the appropriate cell.) Total Peoria Normal Overtime Total Calculate the total contribution margin for the Moline plant. (For amounts with a $0 balance, make sure to enter "O" in the appropriate cell.) - contribution margin Total Moline Normal Overtime Total Now show the calculation of operating income using the contribution margin approach for each plant and the total for Plummer Corporation. contribution margin Peoria Moline Total Contribution margin Operating income Choose from any list or enter any number in the input fields and then continue to the next