

Answered step by step
Verified Expert Solution
Question
1 Approved Answer
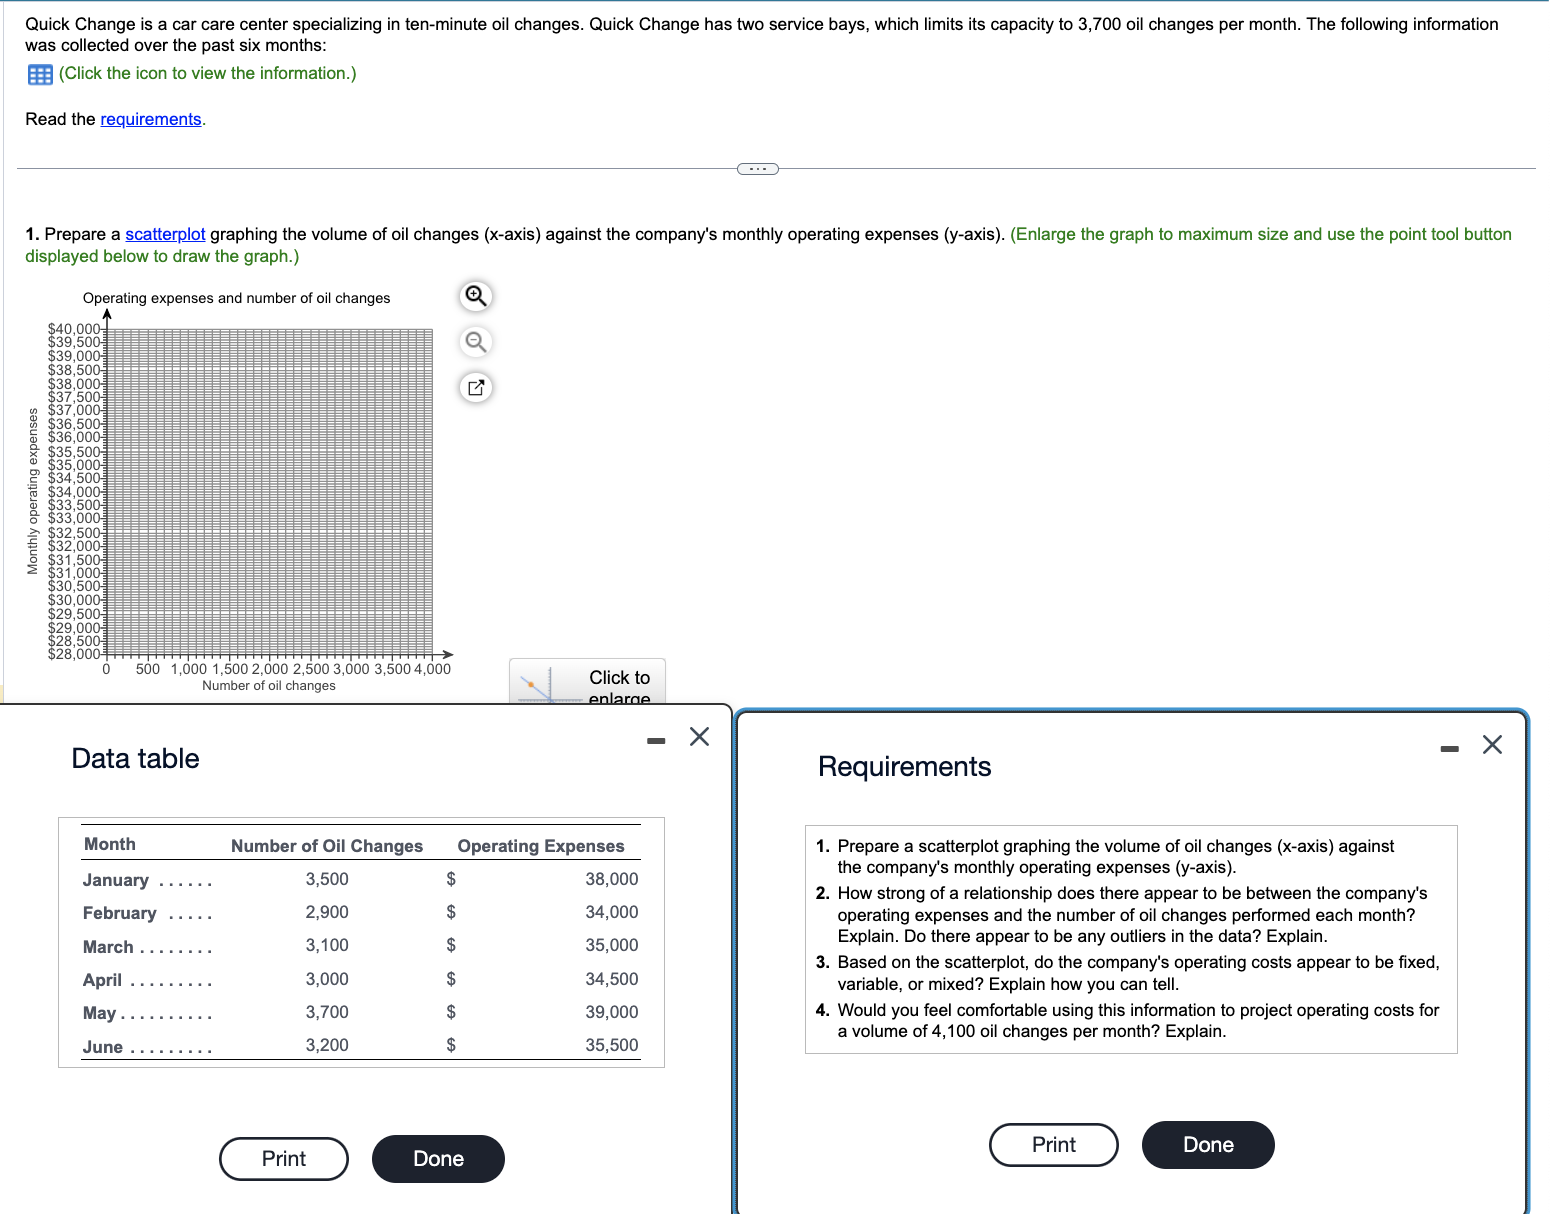
Data table Requirements Prepare a scatterplot graphing the volume of oil changes ( x - axis ) against the company's monthly operating expenses ( y
Data table
Requirements
Prepare a scatterplot graphing the volume of oil changes xaxis against
the company's monthly operating expenses yaxis
How strong of a relationship does there appear to be between the company's
operating expenses and the number of oil changes performed each month?
Explain. Do there appear to be any outliers in the data? Explain.
Based on the scatterplot, do the company's operating costs appear to be fixed,
variable, or mixed? Explain how you can tell.
Would you feel comfortable using this information to project operating costs for
a volume of oil changes per month? Explain.
Step by Step Solution
There are 3 Steps involved in it
Step: 1

Get Instant Access to Expert-Tailored Solutions
See step-by-step solutions with expert insights and AI powered tools for academic success
Step: 2

Step: 3
Ace Your Homework with AI
Get the answers you need in no time with our AI-driven, step-by-step assistance
Get Started
Cadmus Operational Auditing W R Institute Of Internal Auditors Professional Books Series
Authors: David S. Kowalczyk
1st Edition
047182660X, 978-0471826606